Nginx is well-known for its ability to act as a reverse-proxy with small memory footprint. It usually sits in the front-end web tier to redirect connections to available backend services, provided these passed some health checks. Using a reverse-proxy is common when you are running a critical application or service that requires high availability. It also distributes the load equally among the backend services.
![]()
Recently, nginx 1.9 introduced support for TCP load balancing - similar to what HAProxy is capable of. The one major drawback is that it does not support advanced backend health checks. This is required when running MySQL Galera Cluster, as we’ll explain in the next section. Note that this limitation is removed in the paid-only edition called NGINX Plus.
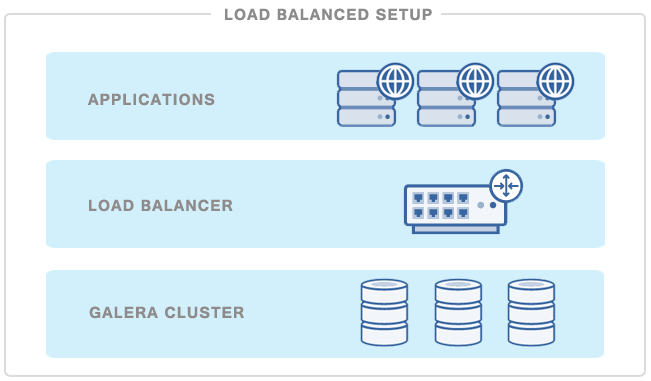
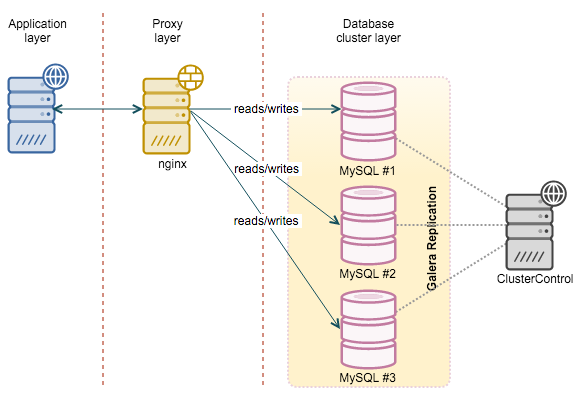
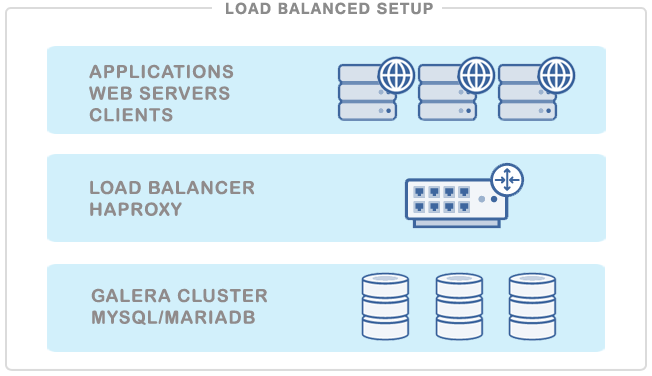
In this blog post, we are going to play around with nginx as a reverse-proxy for MySQL Galera Cluster services to achieve higher availability. We had a Galera cluster up and running, deployed using ClusterControl on CentOS 7.1. We are going to install nginx on a fresh new host, as illustrated in the following diagram:
![]()
Backend Health Checks
With the existence of a synchronously-replicated cluster like Galera or NDB, it has become quite popular to use a TCP reverse-proxy as load balancer. All MySQL nodes are treated equal as one can read or write from any node. No read-write splitting is required, as you would with MySQL master-slave replication. Nginx is not database-aware, so some additional steps are required to configure the health checks for Galera Cluster backends so that they return something understandable.
If you are running HAProxy, a healthcheck script on each MySQL server in the load balancing set should be able to return an HTTP response status. For example, if the backend MySQL server is healthy, then the script will return a simple HTTP 200 OK status code. Else, the script will return 503 Service unavailable. HAProxy can then update the routing table to exclude the problematic backend servers from the load balancing set and redirect the incoming connections only to the available servers. This is well explained in this webinar on HAProxy. Unfortunately, the HAProxy health check uses xinetd to daemonize and listen to a custom port (9200) which is not configurable in nginx yet.
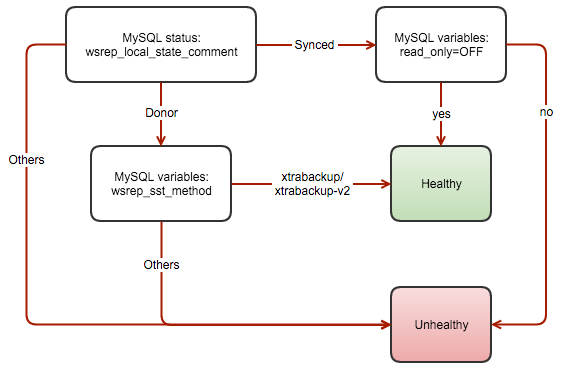
The following flowchart illustrates the process to report the health of a Galera node for multi-master setup:
![]()
At the time of this writing, NGINX Plus (the paid release of nginx) also supports advanced backend health but it does not support custom backend monitoring port.
Using clustercheck-iptables
To overcome this limitation, we’ve created a healthcheck script called clustercheck-iptables. It is a background script that checks the availability of a Galera node, and adds a redirection port using iptables if the Galera node is healthy (instead of returning HTTP response). This allows other TCP-load balancers with limited health check capabilities to monitor the backend Galera nodes correctly. Other than HAProxy, you can now use your favorite reverse proxy like nginx (>1.9), IPVS, keepalived, piranha, distributor, balance or pen to load balance requests across Galera nodes.
So how does it work? The script performs a health check every second on each Galera node. If the node is healthy (wsrep_cluster_state_comment=Synced and read_only=OFF) or (wsrep_cluster_state_comment=Donor and wsrep_sst_method=xtrabackup/xtrabackup-v2), a port redirection will be setup using iptables (default: 3308 redirects to 3306) using the following command:
$ iptables -t nat -A PREROUTING -s $0.0.0.0/0 -p tcp --dport 3308 -j REDIRECT --to-ports 3306
Else, the above rule will be taken out from the iptables PREROUTING chain. On the load balancer, define the designated redirection port (3308) instead. If the backend node is "unhealthy", port 3308 will be unreachable because the corresponding iptables rule is removed on the database node. The load balancer shall then exclude it from the load balancing set.
Let’s install the script and see how it works in practice.
1. On the database servers, run the following commands to install the script:
$ git clone https://github.com/ashraf-s9s/clustercheck-iptables
$ cp clustercheck-iptables/mysqlchk_iptables /usr/local/sbin
2. By default, the script will use a MySQL user called “mysqlchk_user” with password “mysqlchk_password”. We need to ensure this MySQL user exists with the corresponding password before the script is able to perform health checks. Run the following DDL statements on one of the DB nodes (Galera should replicate the statement to the other nodes):
mysql> GRANT PROCESS ON *.* TO 'mysqlchk_user'@'localhost' IDENTIFIED BY 'mysqlchk_password';
mysql> FLUSH PRIVILEGES;
** If you would like to run as different user/password, specify -u and/or -p argument in the command line. See examples on the Github page.
3. This script requires running iptables. In this example, we ran on CentOS 7 which comes with firewalld by default. We have to install iptables-services beforehand:
$ yum install -y iptables-services
$ systemctl enable iptables
$ systemctl start iptables
Then, setup basic rules for MySQL Galera Cluster so iptables won’t affect the database communication:
$ iptables -I INPUT -m tcp -p tcp --dport 3306 -j ACCEPT
$ iptables -I INPUT -m tcp -p tcp --dport 3308 -j ACCEPT
$ iptables -I INPUT -m tcp -p tcp --dport 4444 -j ACCEPT
$ iptables -I INPUT -m tcp -p tcp --dport 4567:4568 -j ACCEPT
$ service iptables save
$ service iptables restart
4. Once the basic rules are added, verify them with the following commands:
$ iptables -L -n
5. Test mysqlchk_iptables:
$ mysqlchk_iptables -t
Detected variables/status:
wsrep_local_state: 4
wsrep_sst_method: xtrabackup-v2
read_only: OFF

[11-11-15 08:33:49.257478192] [INFO] Galera Cluster Node is synced.
6. Looks good. Now we can daemonize the health check script:
$ mysqlchk_iptables -d
/usr/local/sbin/mysqlchk_iptables started with PID 66566.
7. Our PREROUTING rules will look something like this:
$ iptables -L -n -t nat
Chain PREROUTING (policy ACCEPT)
target     prot opt source               destination
REDIRECT   tcp  --  0.0.0.0/0            0.0.0.0/0            tcp dpt:3308 redir ports 3306

Chain INPUT (policy ACCEPT)
target     prot opt source               destination

Chain OUTPUT (policy ACCEPT)
target     prot opt source               destination

Chain POSTROUTING (policy ACCEPT)
target     prot opt source               destination
8. Finally, add the health check command into /etc/rc.local so it starts automatically on boot:
echo '/usr/local/sbin/mysqlchk_iptables -d'>> /etc/rc.local
In some distributions, you need to verify that rc.local holds the correct permission to execute scripts on boot. Verify with:
$ chmod +x /etc/rc.local
From the application side, verify that you can connect to MySQL through port 3308. Repeat the above steps (except step #2) for the remaining DB nodes. Now, we have configured our backend health checks correctly. Let’s set up our MySQL load balancer as described in the next section.
Setting Up nginx as MySQL Load Balancer
1. On the load balancer node, install the required packages:
$ yum -y install pcre-devel zlib-devel
2. Install nginx 1.9 from source with TCP proxy module (--with-stream):
$ wget http://nginx.org/download/nginx-1.9.6.tar.gz
$ tar -xzf nginx-1.9.6.tar.gz
$ ./configure --with-stream
3. Add the following lines into nginx configuration file located at /usr/local/nginx/conf/nginx.conf:
stream {
      upstream stream_backend {
        zone tcp_servers 64k;
        server 192.168.55.201:3308;
        server 192.168.55.202:3308;
        server 192.168.55.203:3308;
    }

    server {
        listen 3307;
        proxy_pass stream_backend;
        proxy_connect_timeout 1s;
    }
}
4. Start nginx:
$ /usr/local/nginx/sbin/nginx
5. Verify that nginx is listening to port 3307 that we have defined. MySQL connections should be coming via this port of this node and then redirects to available backends on port 3308. Then the respective DB node will redirect it to port 3306 where MySQL is listening:
$ netstat -tulpn | grep 3307
tcp        0      0 0.0.0.0:3307            0.0.0.0:*               LISTEN      5348/nginx: master
Great. We have now set up our nginx instance as MySQL Galera Cluster load balancer. Let’s test it out!
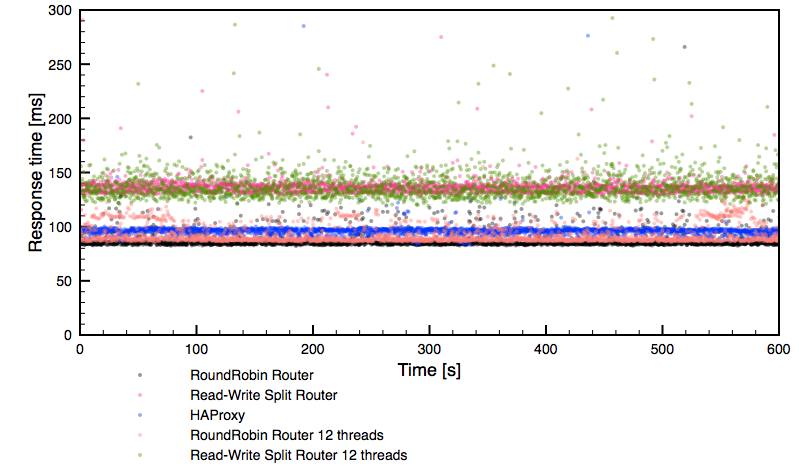
Testing
Let’s perform some tests to verify that our Galera cluster is correctly load balanced. We performed various exercises to look at nginx and Galera cluster work in action. We performed the following actions consecutively:
- Turn g1.local to read-only=ON and read_only=OFF.
- Kill mysql service on g1.local and force SST when startup.
- Kill the other two database nodes so g1.local will become non-primary.
- Bootstrap g1.local from non-primary state.
- Rejoin the other 2 nodes back to the cluster.
The screencast below contains several terminal outputs which explained as follows:
- Terminal 1 (top left): iptables PREROUTING chain output
- Terminal 2 (top right): MySQL error log for g1.local
- Terminal 3 (middle left): Application output when connecting to nginx load balancer. It reports date, hostname, wsrep_last_committed and wsrep_local_state_comment
- Terminal 4 (middle right): Output of /var/log/mysqlchk_iptables
- Terminal 5 (bottom left): Output of read_only and wsrep_sst_method on g1.local
- Terminal 6 (bottom right): Action console
The following asciinema recording shows the result:
Summary
Galera node health checks by a TCP load balancer was limited to HAProxy due to its ability to use a custom port for backend health checks. With this script, it’s now possible for any TCP load balancers/reverse-proxies to monitor Galera nodes correctly.
You are welcome to fork, pull request and extend the capabilities of this script.