Choosing your HA topology
There are various ways to retain high availability with databases. You can use Virtual IPs (VRRP) to manage host availability, you can use resource managers like Zookeeper and Etcd to (re)configure your applications or use load balancers/proxies to distribute the workload over all available hosts.
The Virtual IPs need either an application to manage them (MHA, Orchestrator), some scripting (KeepaliveD, Pacemaker/Corosync) or an engineer to manually fail over and the decision making in the process can become complex. The Virtual IP failover is a straightforward and simple process by removing the IP address from one host, assigning it to another and use arping to send a gratuitous ARP response. In theory a Virtual IP can be moved in a second but it will take a few seconds before the failover management application is sure the host has failed and acts accordingly. In reality this should be somewhere between 10 and 30 seconds. Another limitation of Virtual IPs is that some cloud providers do not allow you to manage your own Virtual IPs or assign them at all. E.g., Google does not allow you to do that on their compute nodes.
Resource managers like Zookeeper and Etcd can monitor your databases and (re)configure your applications once a host fails or a slave gets promoted to master. In general this is a good idea but implementing your checks with Zookeeper and Etcd is a complex task.
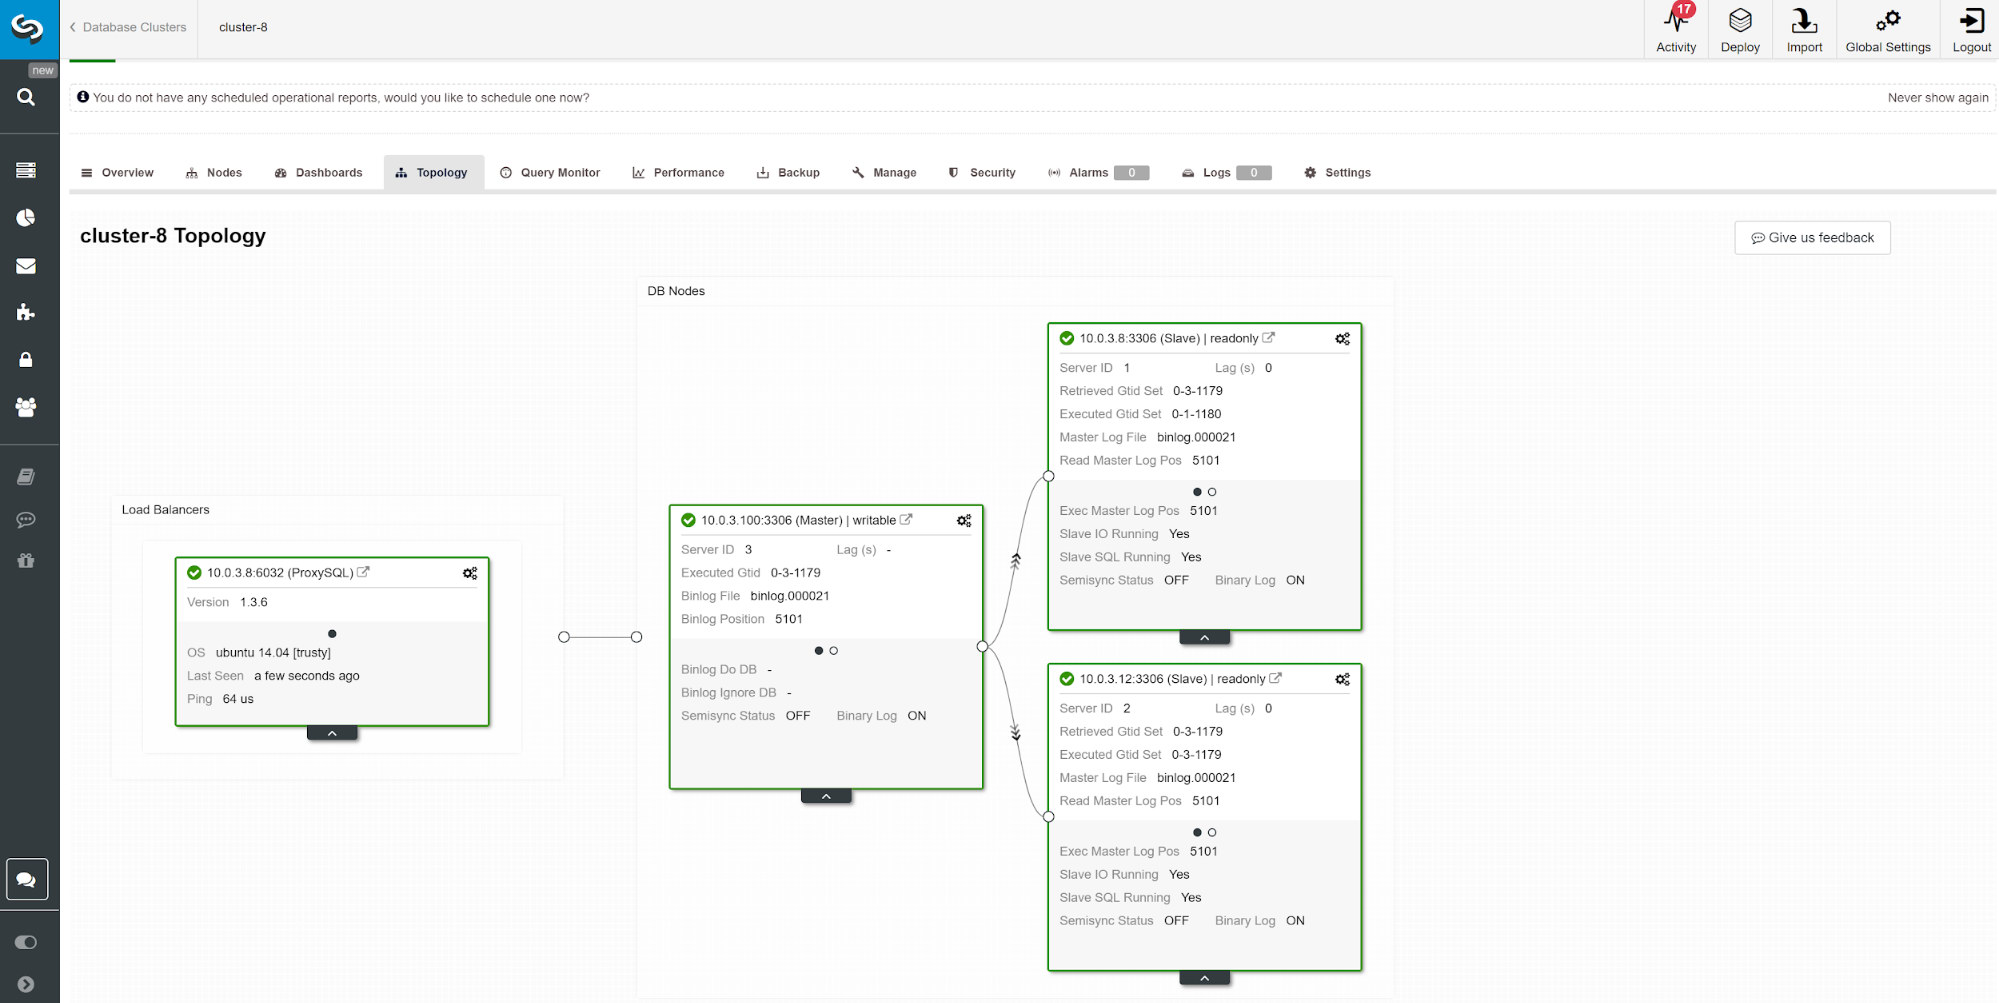
A load balancer or proxy will sit in between the application and the database host and work transparently as if the client would connect to the database host directly. Just like with the Virtual IP and resource managers, the load balancers and proxies also need to monitor the hosts and redirect the traffic if one host is down. ClusterControl supports two proxies: HAProxy and MaxScale and both are supported for MySQL master-slave replication and Galera cluster. HAProxy and MaxScale both have their own use cases, we will describe them in this post as well.
Why do you need a load balancer?
In theory you don’t need a load balancer but in practice you will prefer one. We’ll explain why.
If you have virtual IPs setup, all you have to do is point your application to the correct (virtual) IP address and everything should be fine connection wise. But suppose you have scaled out the number of read replicas, you might want to provide virtual IPs for each of those read replicas as well because of maintenance or availability reasons. This might become a very large pool of virtual IPs that you have to manage. If one of those read replicas had a failure, you need to re-assign the virtual IP to another host or else your application will connect to either a host that is down or in worst case, a lagging server with stale data. Keeping the replication state to the application managing the virtual IPs is therefore necessary.
Also for Galera there is a similar challenge: you can in theory add as many hosts as you’d like to your application config and pick one at random. The same problem arises when this host is down: you might end up connecting to an unavailable host. Also using all hosts for both reads and writes might also cause rollbacks due to the optimistic locking in Galera. If two connections try to write to the same row at the same time, one of them will receive a roll back. In case your workload has such concurrent updates, it is advised to only use one node in Galera to write to. Therefore you want a manager that keeps track of the internal state of your database cluster.
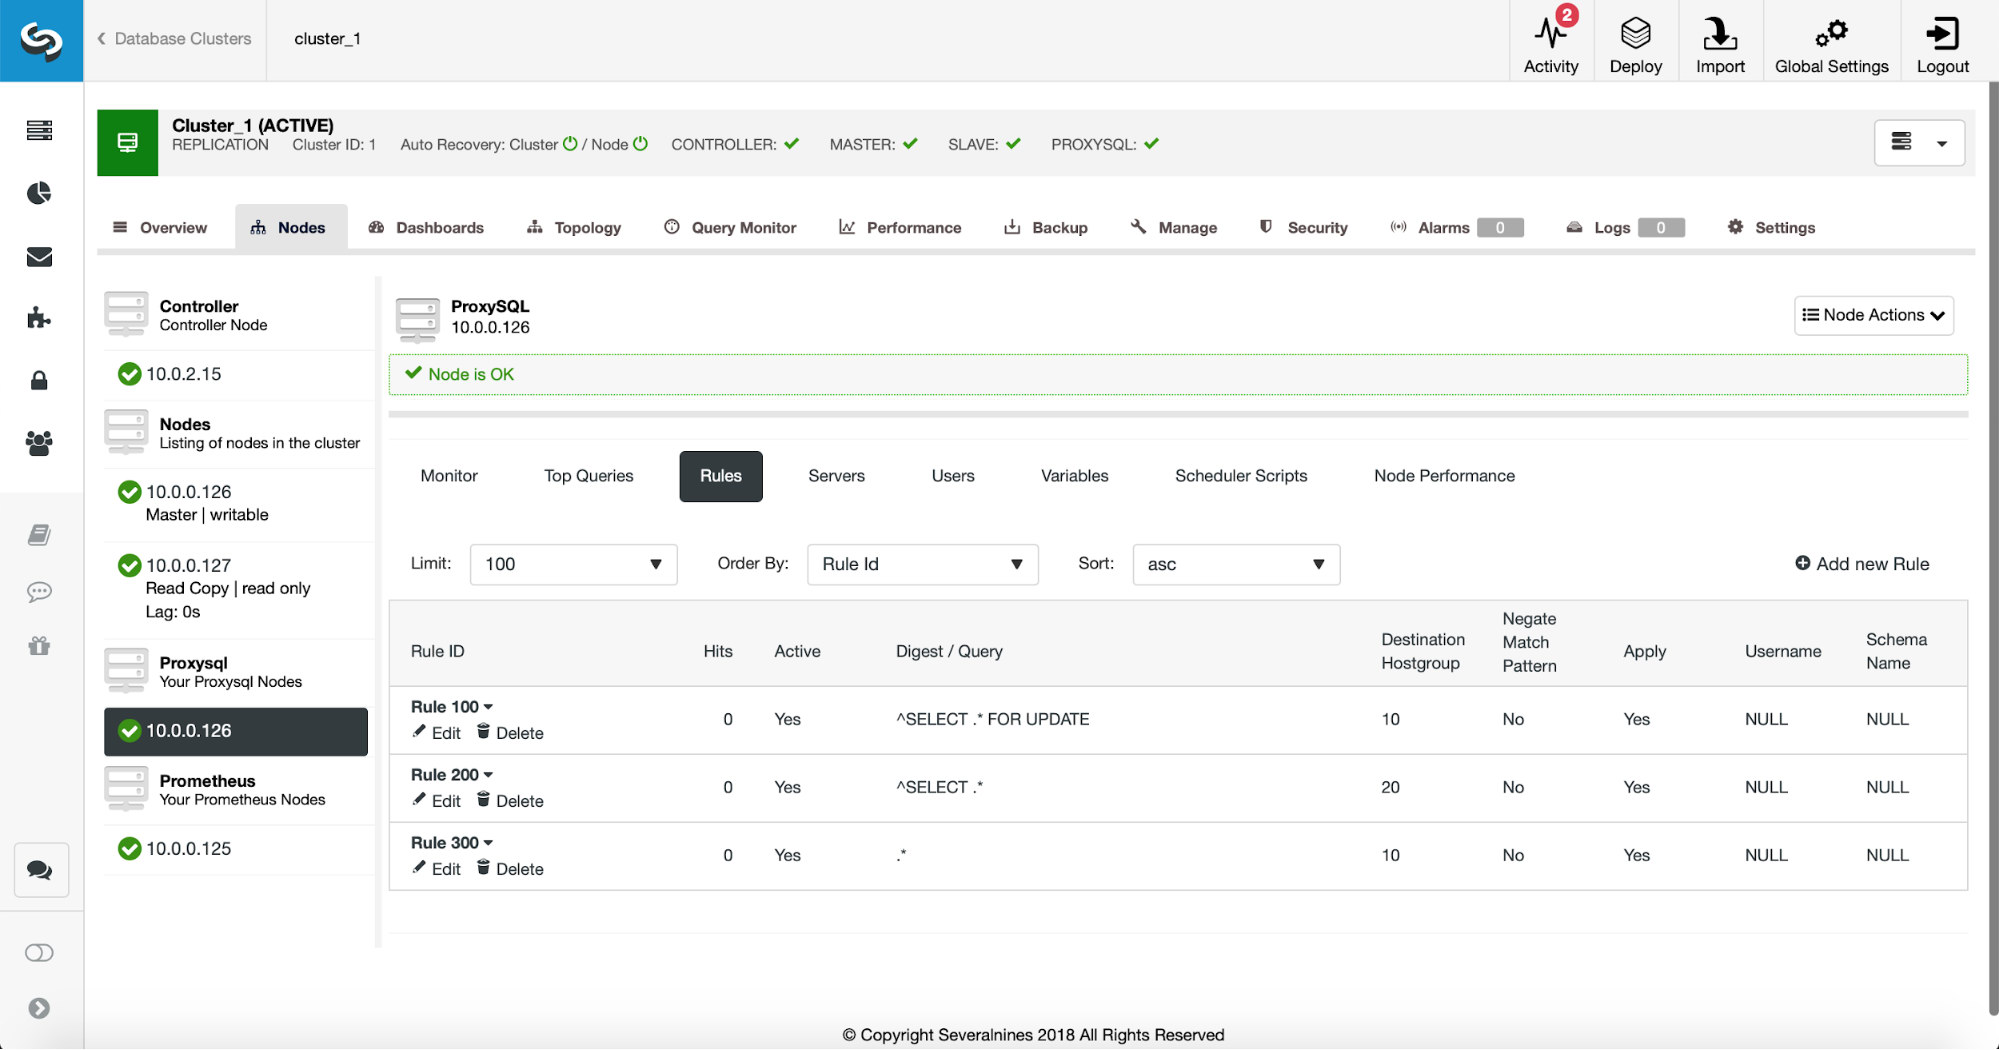
Both HAProxy and MaxScale will offer you the functionality to monitor the database hosts and keep state of your cluster and its topology. For replication setups, in case a slave replica is down, both HAProxy and MaxScale can redistribute the connections to another host. But if a replication master is down, HAProxy will deny the connection and MaxScale will give back a proper error to the client. For Galera setups, both load balancers can elect a master node from the Galera cluster and only send the write operations to that specific node.
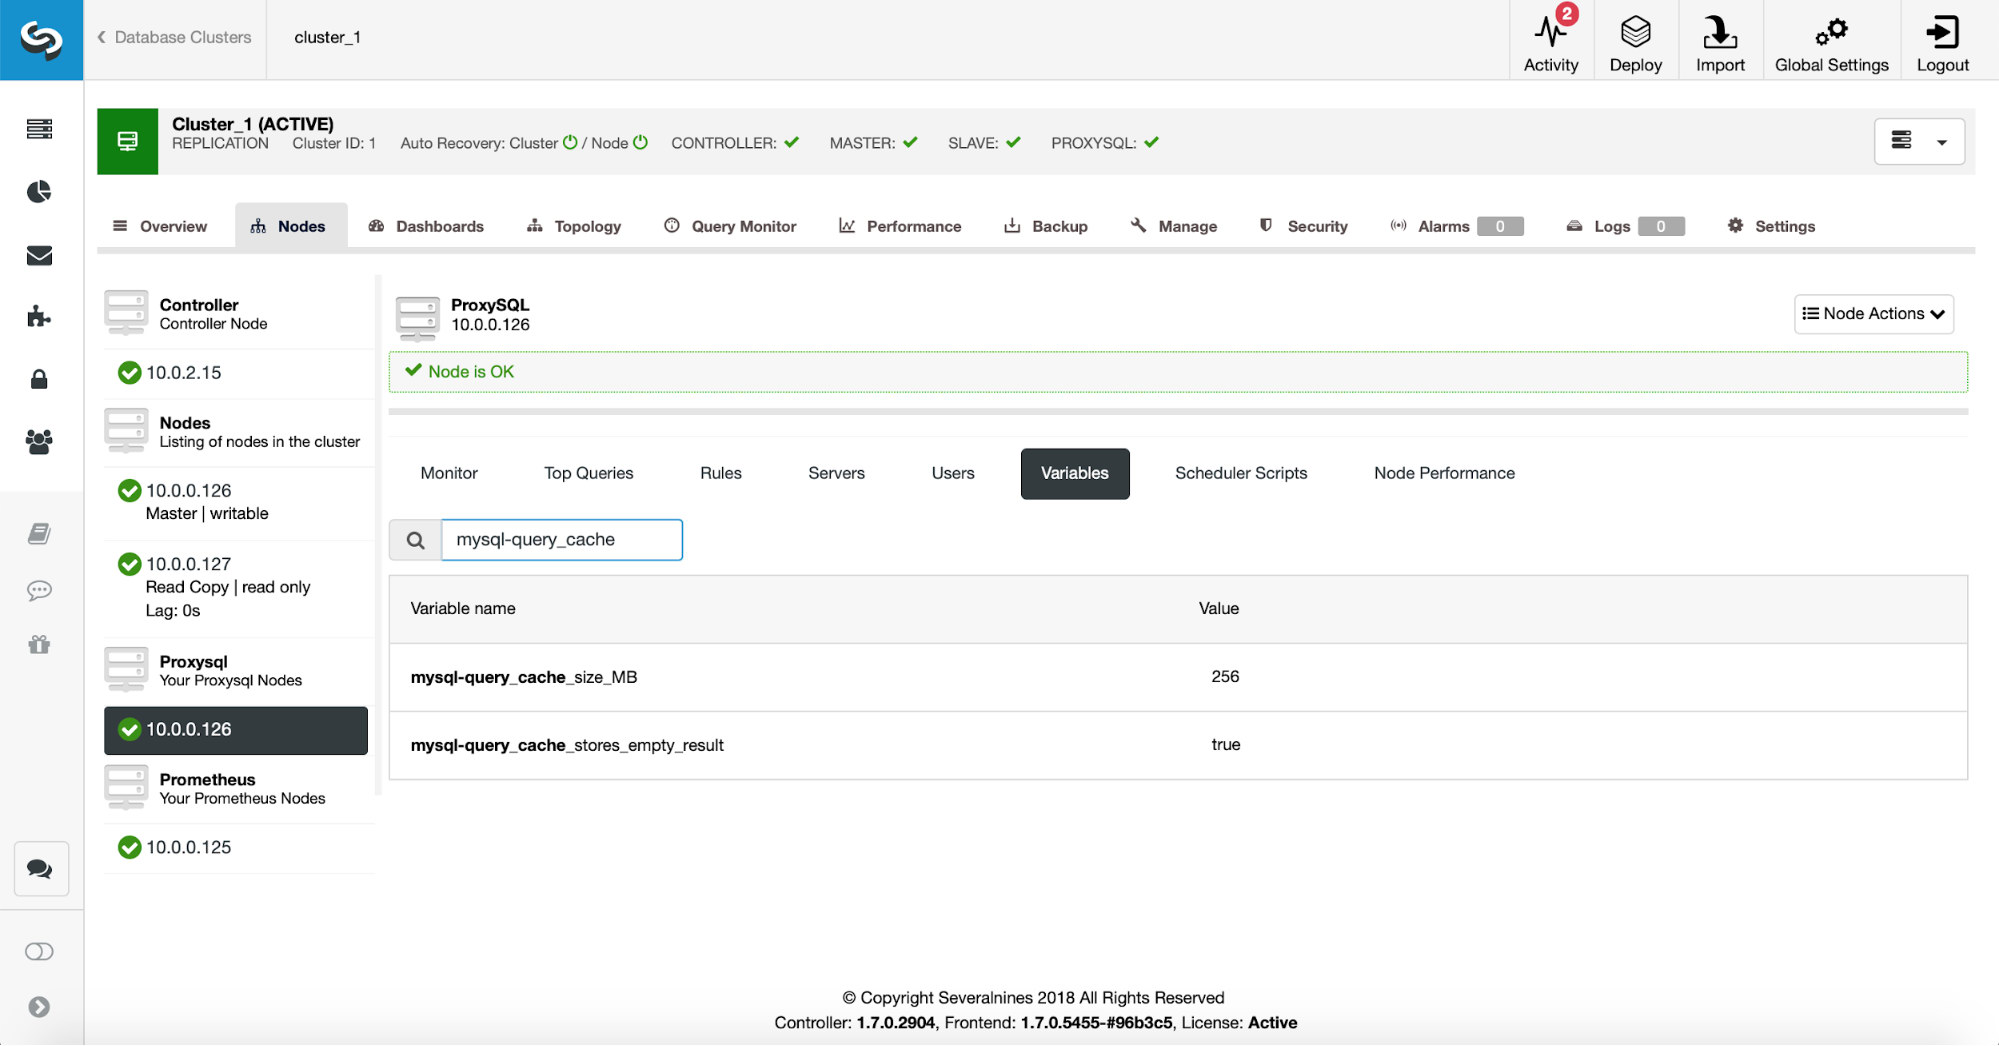
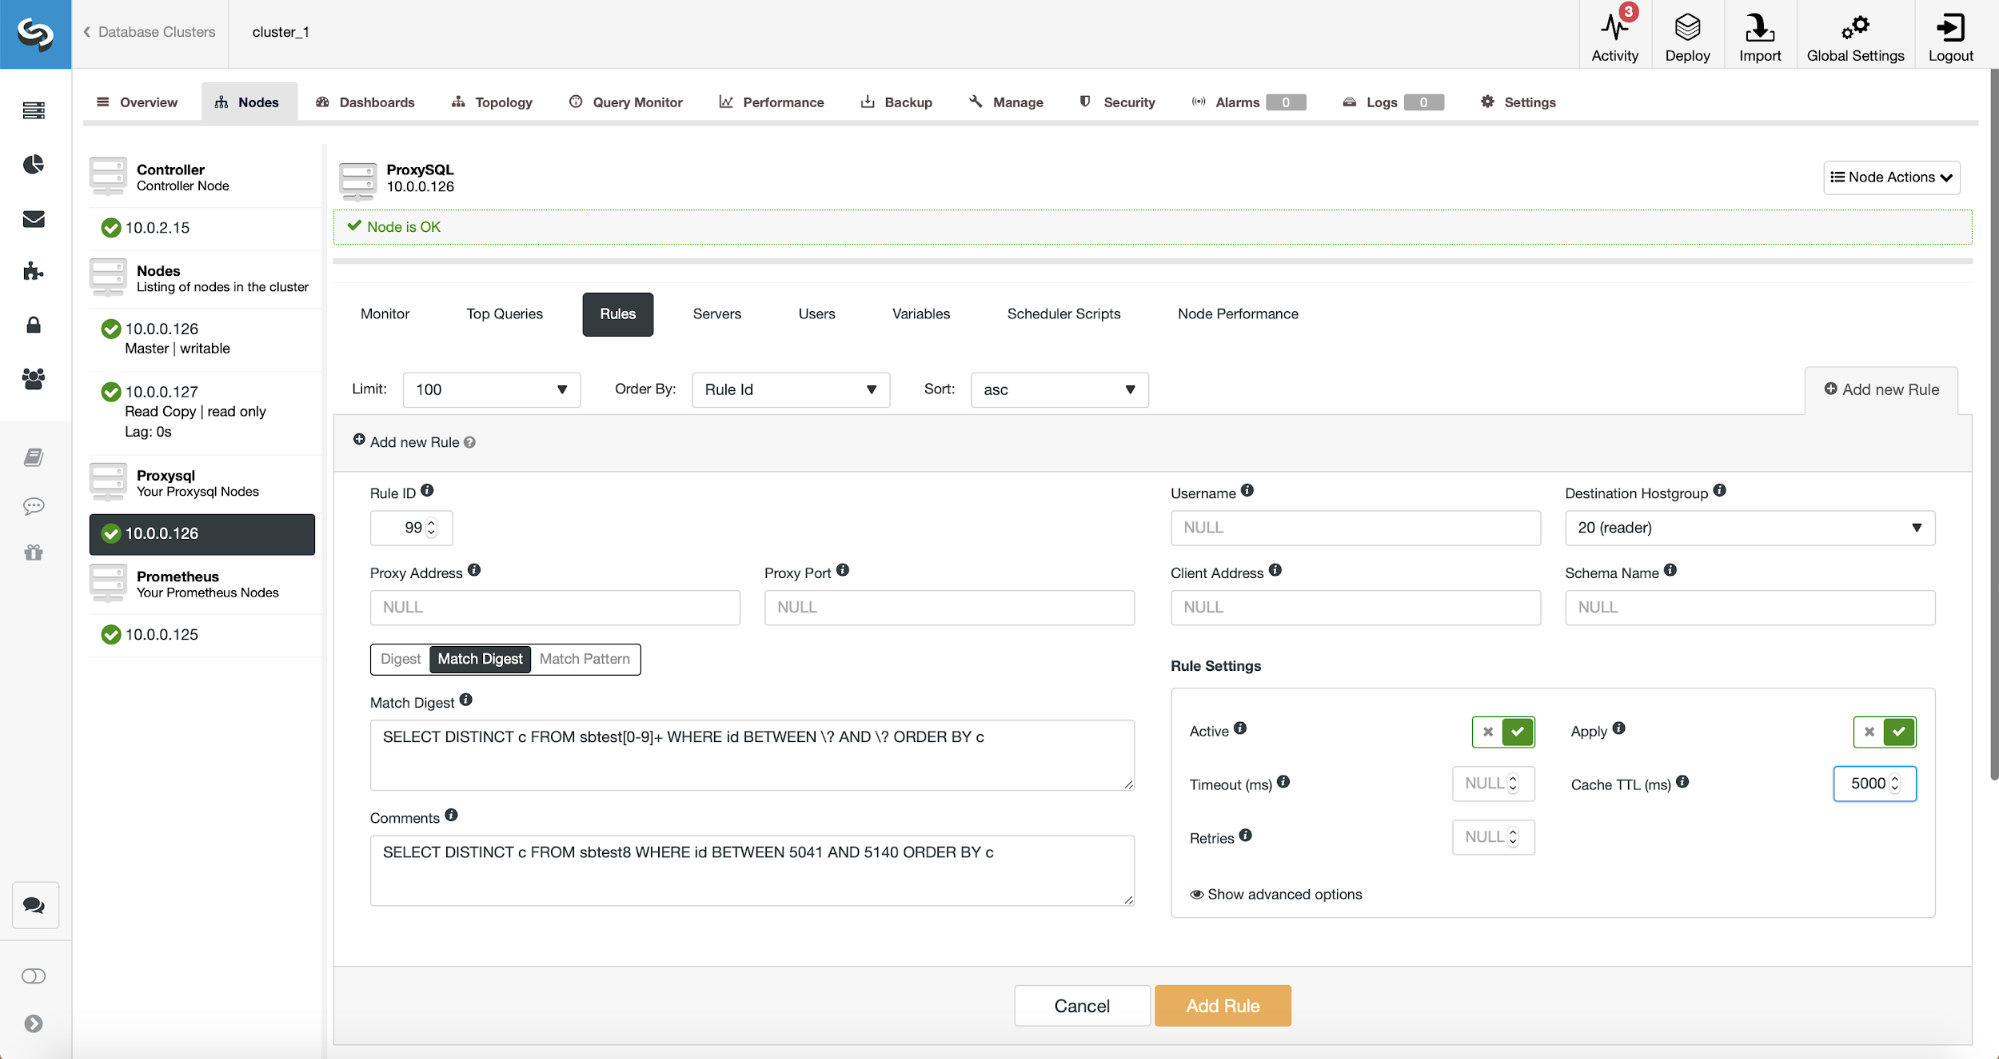
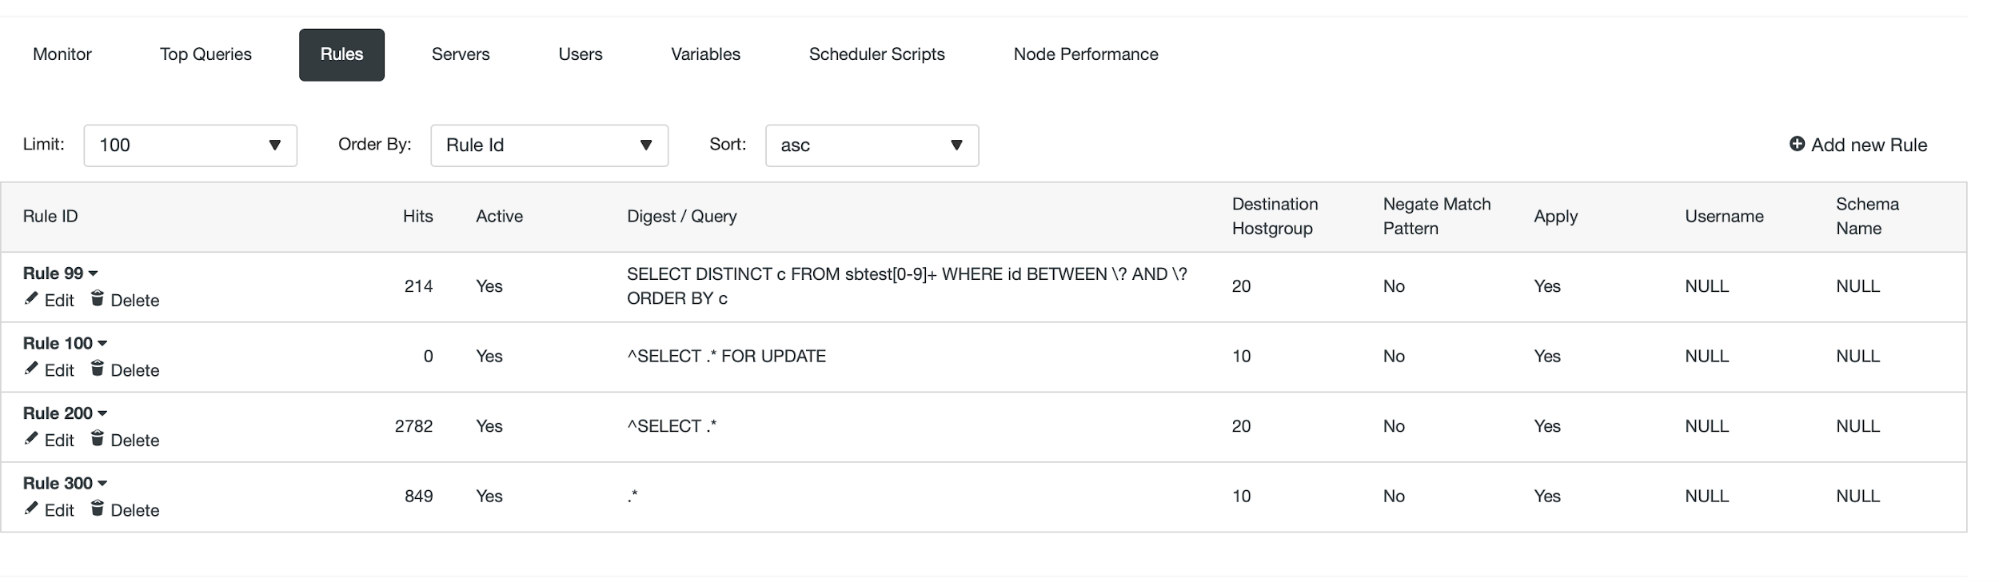
On the surface HAProxy and MaxScale may seem to be similar solutions, but they differ a lot in features and the way they distribute connections and queries. Both HAProxy and MaxScale can distribute connections using round-robin. You can utilize the round-robin also to split reads by designating a specific port for sending reads to the slaves and another port to send writes to the master. Your application will have to decide whether to use the read or write port. Since MaxScale is an intelligent proxy, it is database aware and is also able to analyze your queries. MaxScale is able to do read/write splitting on a single port by detecting whether you are performing a read or write operation and connecting to the designated slaves or master in your cluster. MaxScale includes additional functionality like binlog routing, audit logging and query rewriting but we will have to cover these in a separate article.
That should be enough background information on this topic, so let’s see how you can deploy both load balancers for MySQL replication and Galera topologies.
Deploying HAProxy
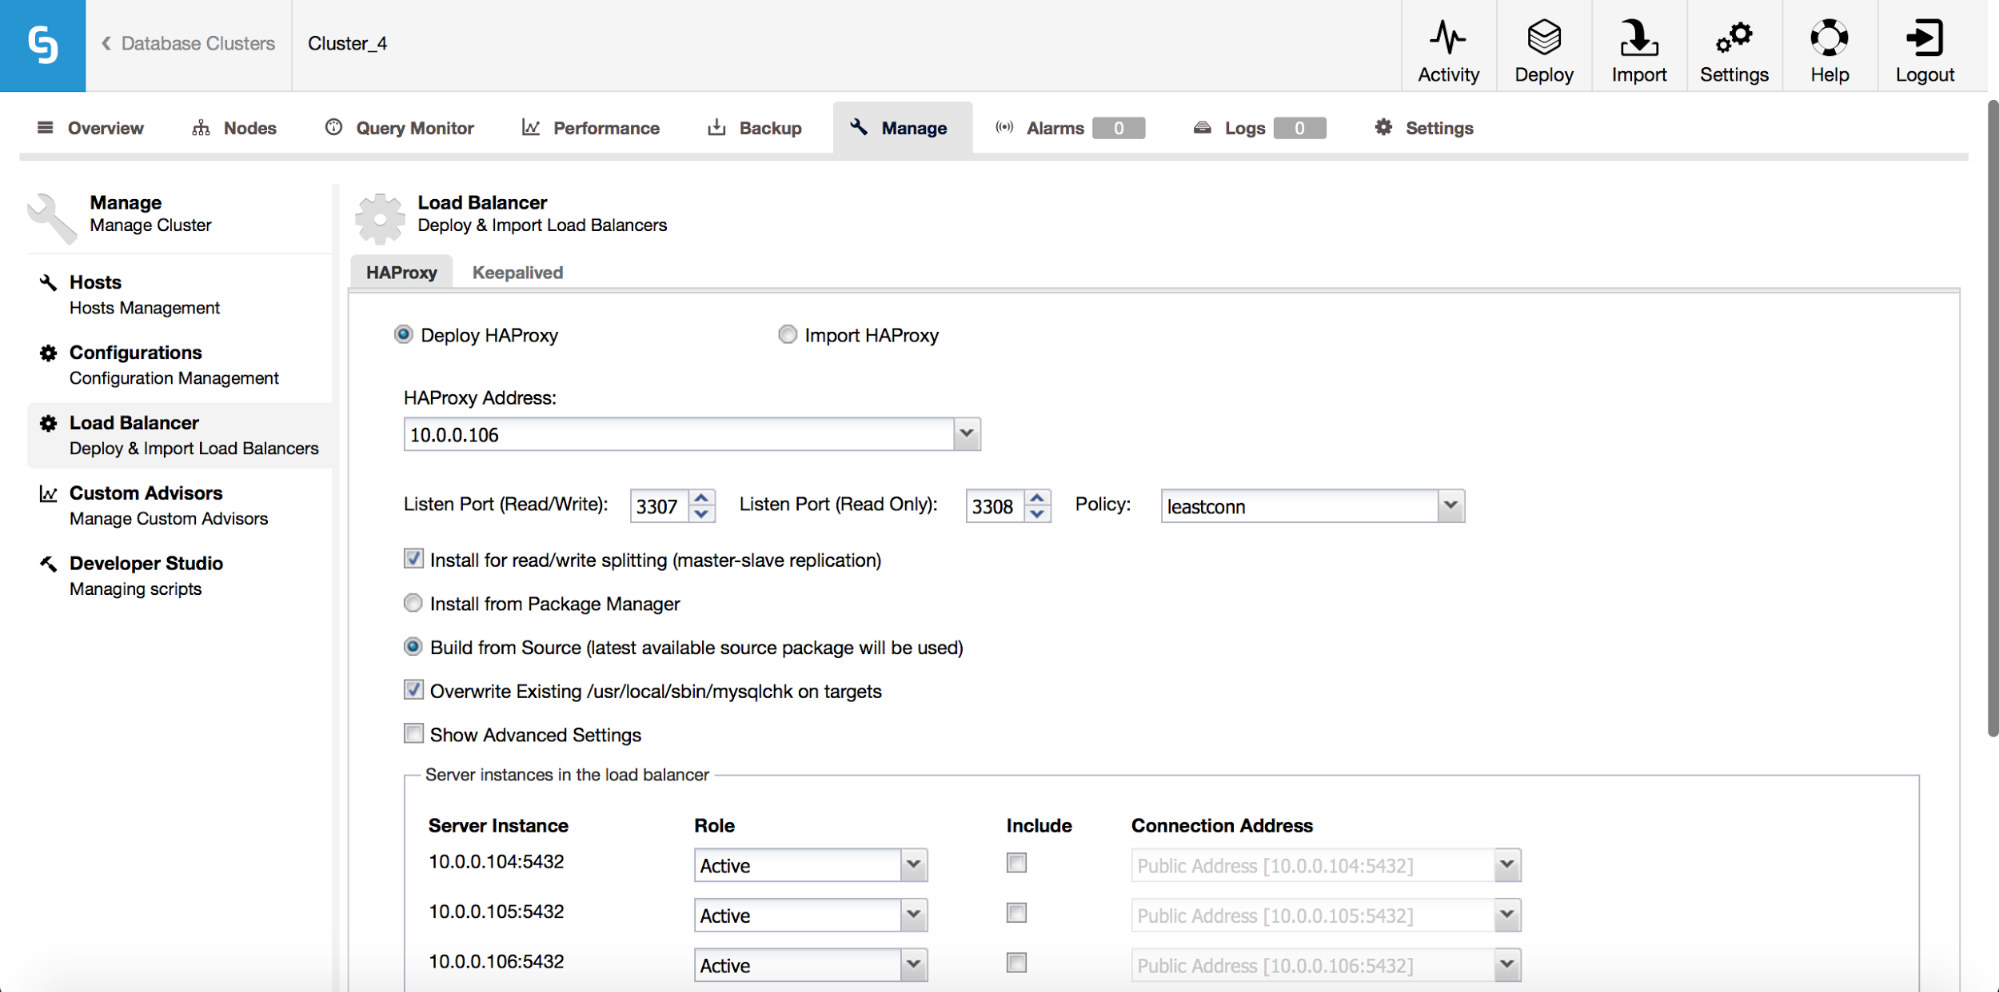
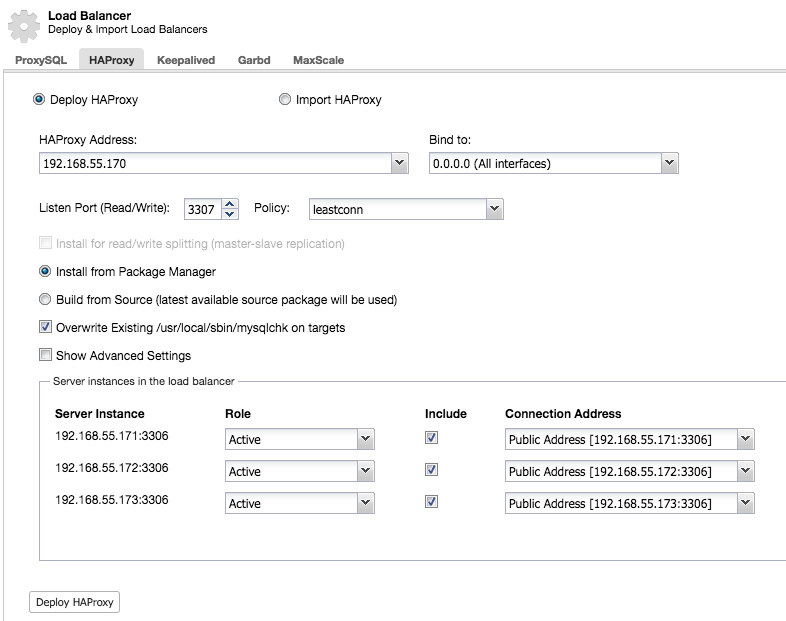
Using ClusterControl to deploy HAProxy on a Galera cluster is easy: go to the relevant cluster and select “Add Load Balancer”:

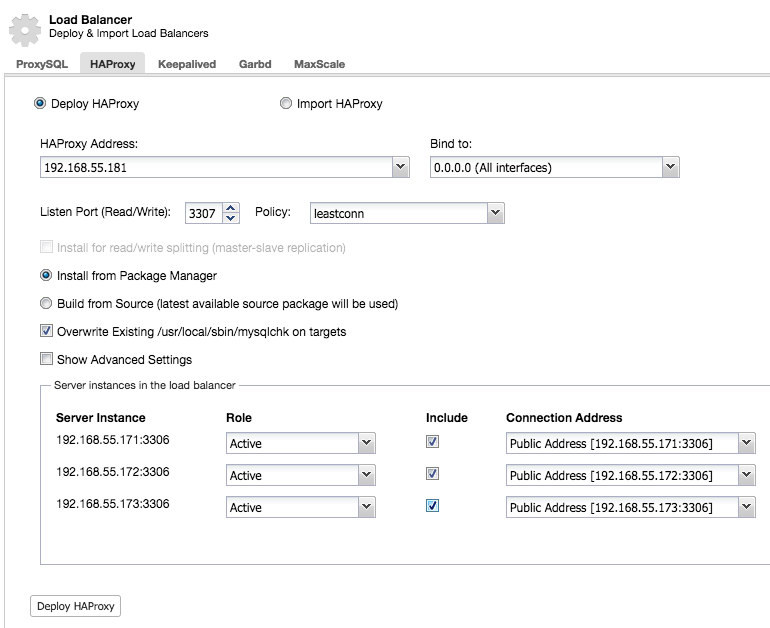
And you will be able to deploy an HAProxy instance by adding the host address and selecting the server instances you wish to include in the configuration:

By default the HAProxy instance will be configured to send connections to the server instances receiving the least number of connections, but you can change that policy to either round robin or source.
Under advanced settings you can set timeouts, maximum amount of connections and even secure the proxy by whitelisting an IP range for the connections.
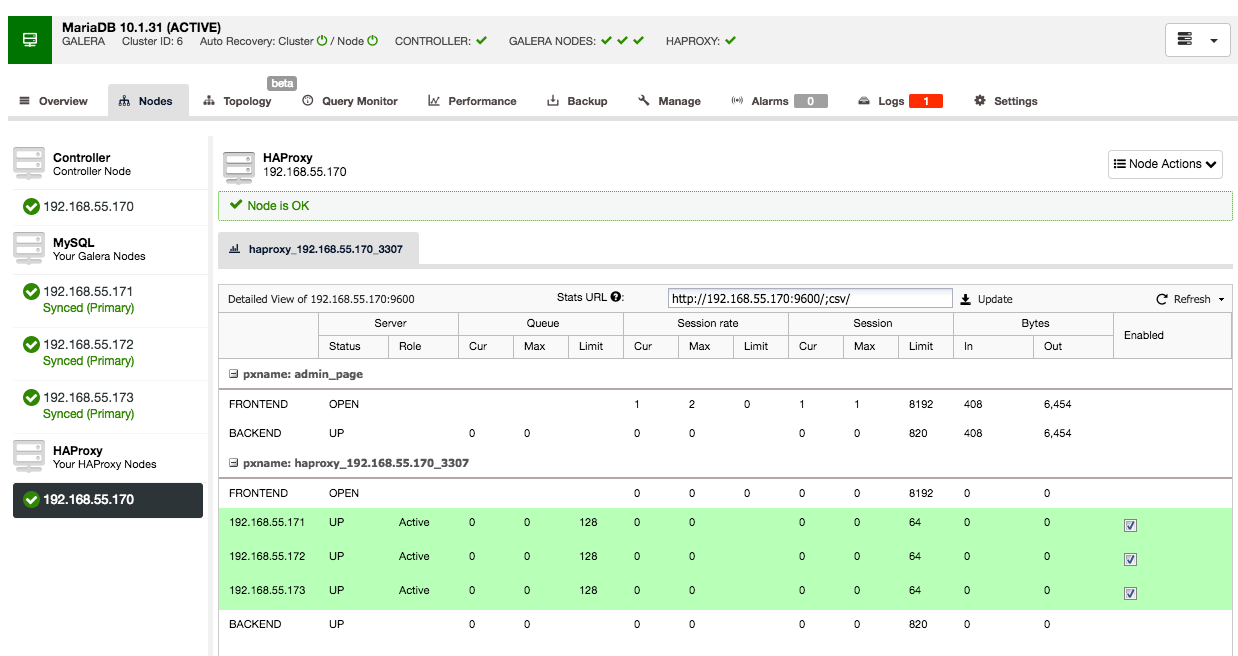
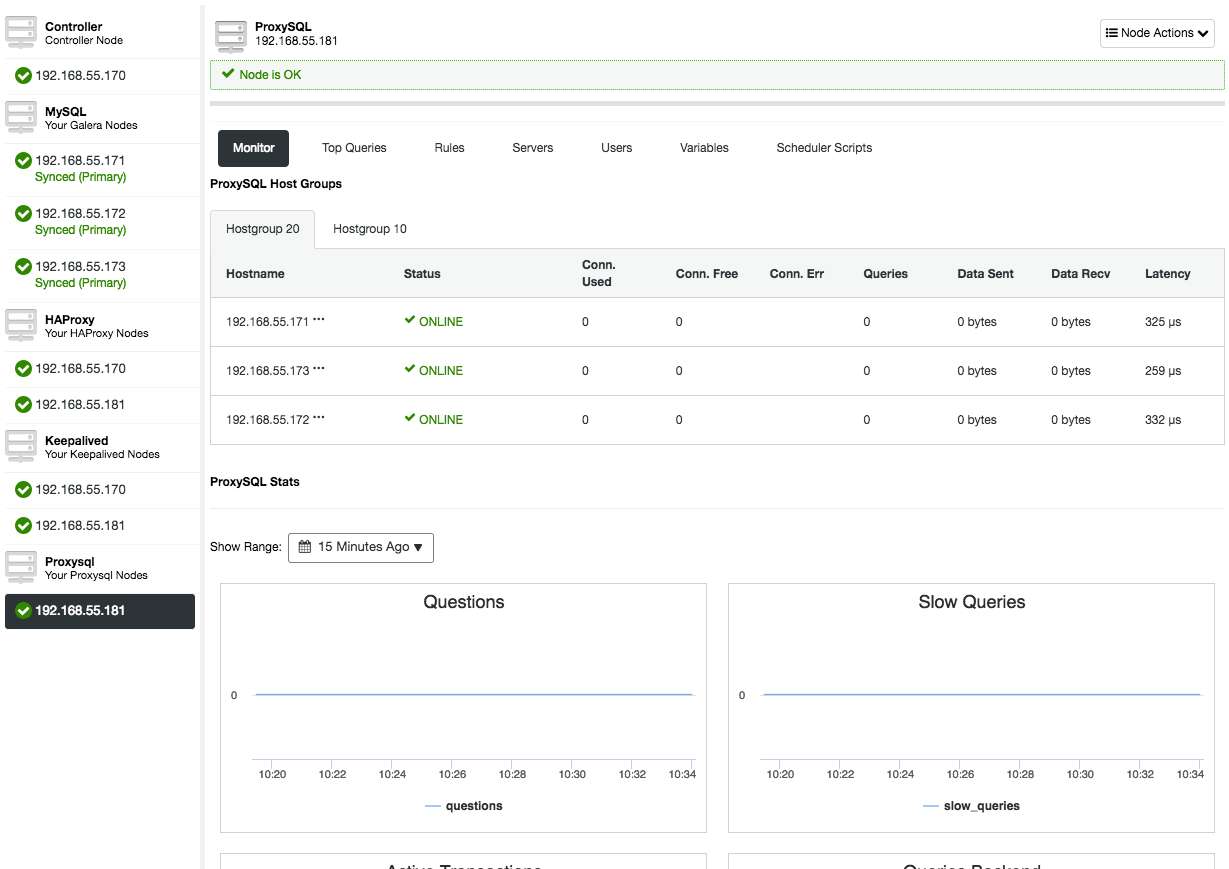
Under the nodes tab of that cluster, the HAProxy node will appear:

Now your Galera cluster is also available via the newly deployed HAProxy node on port 3307. Don’t forget to GRANT your application access from the HAProxy IP, as now the traffic will be incoming from the proxy instead of the application hosts. Also, remember to point your application connection to the HAProxy node.
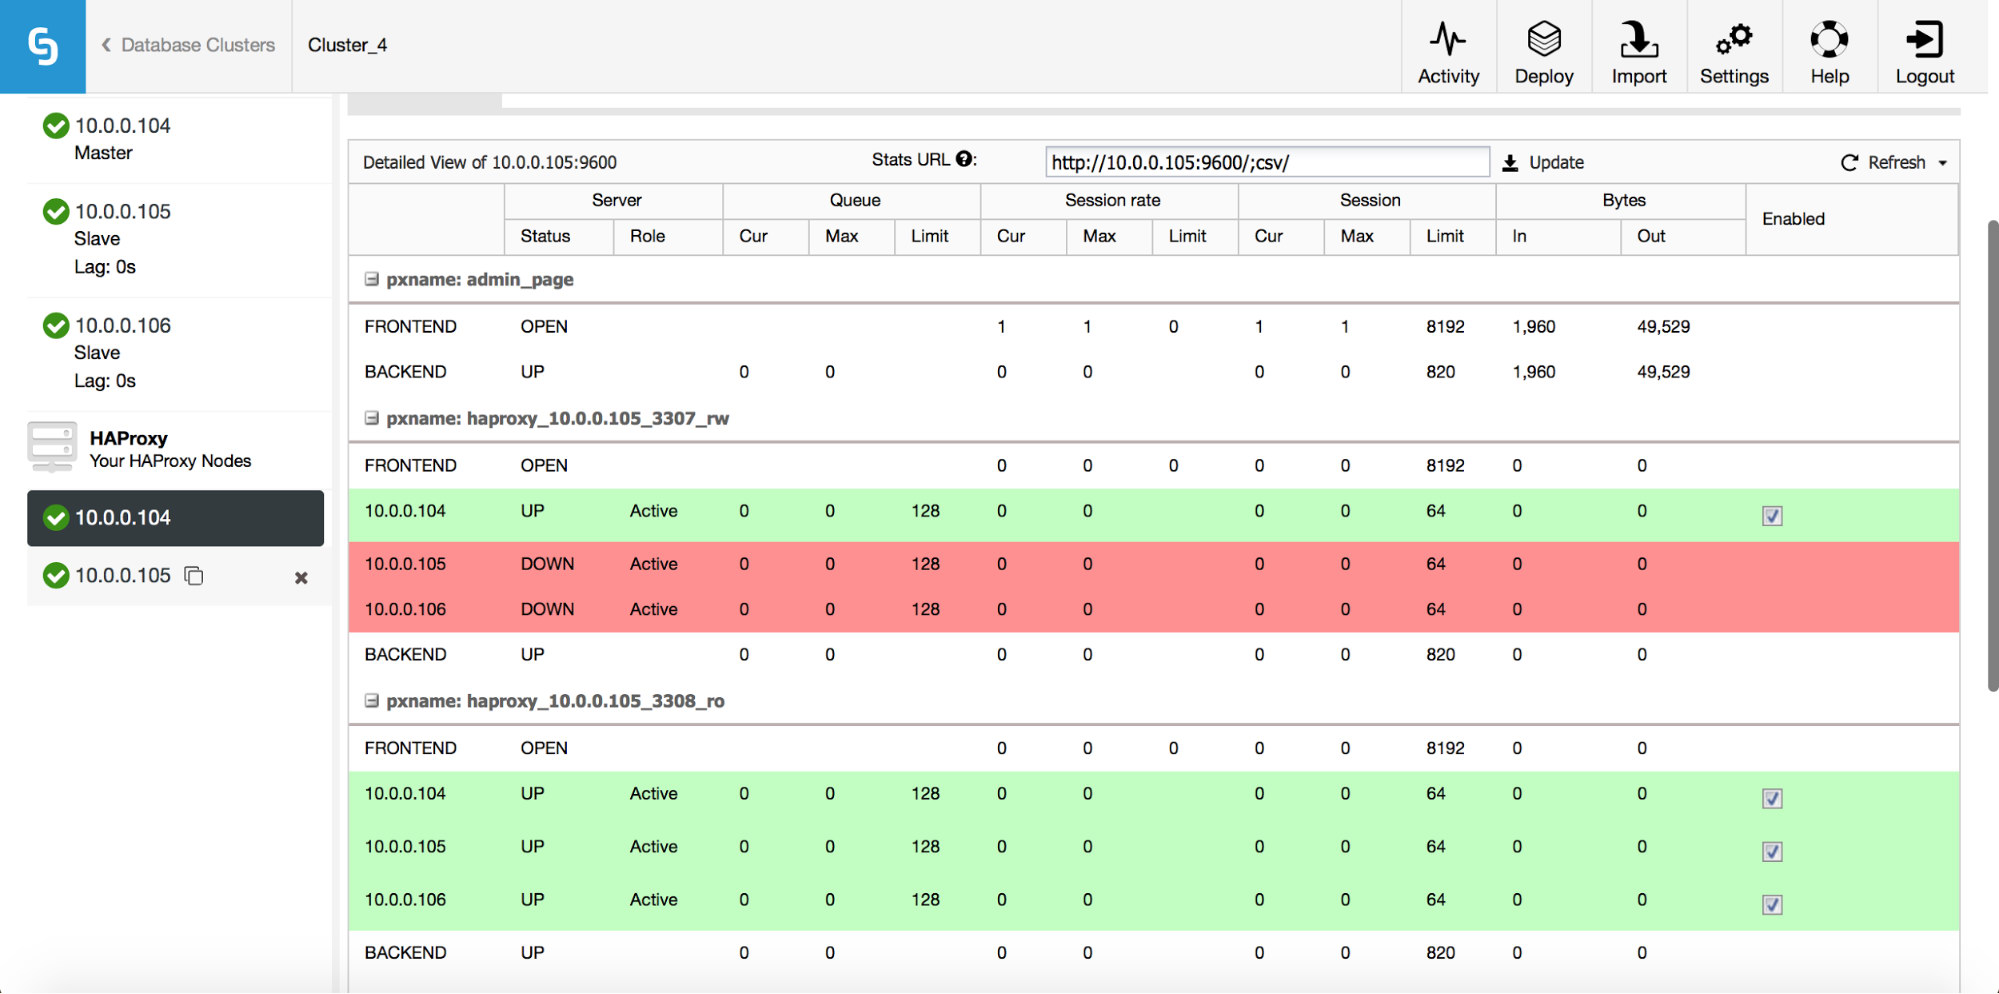
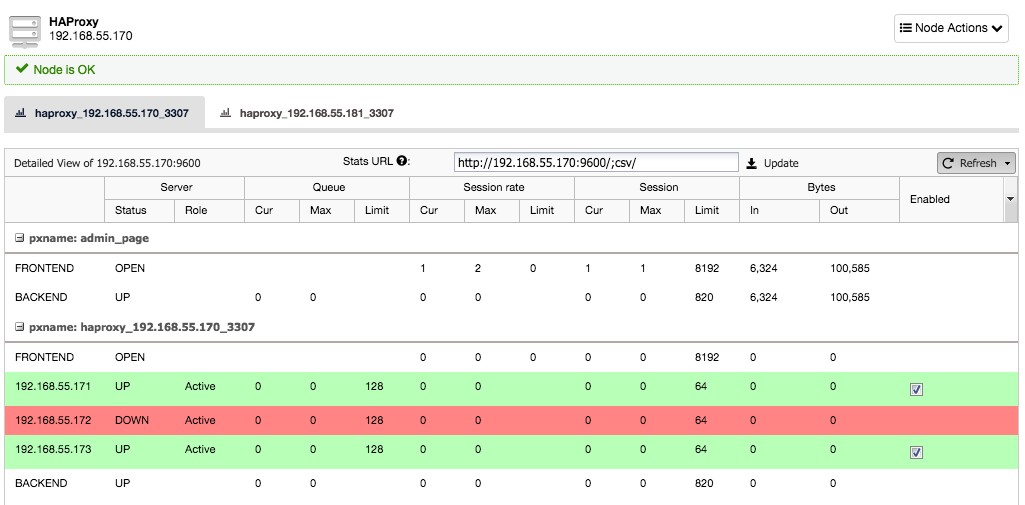
Now suppose the one server instance would go down, HAProxy will notice this within a few seconds and stop sending traffic to this instance:

The two other nodes are still fine and will keep receiving traffic. This retains the cluster highly available without the client even noticing the difference.
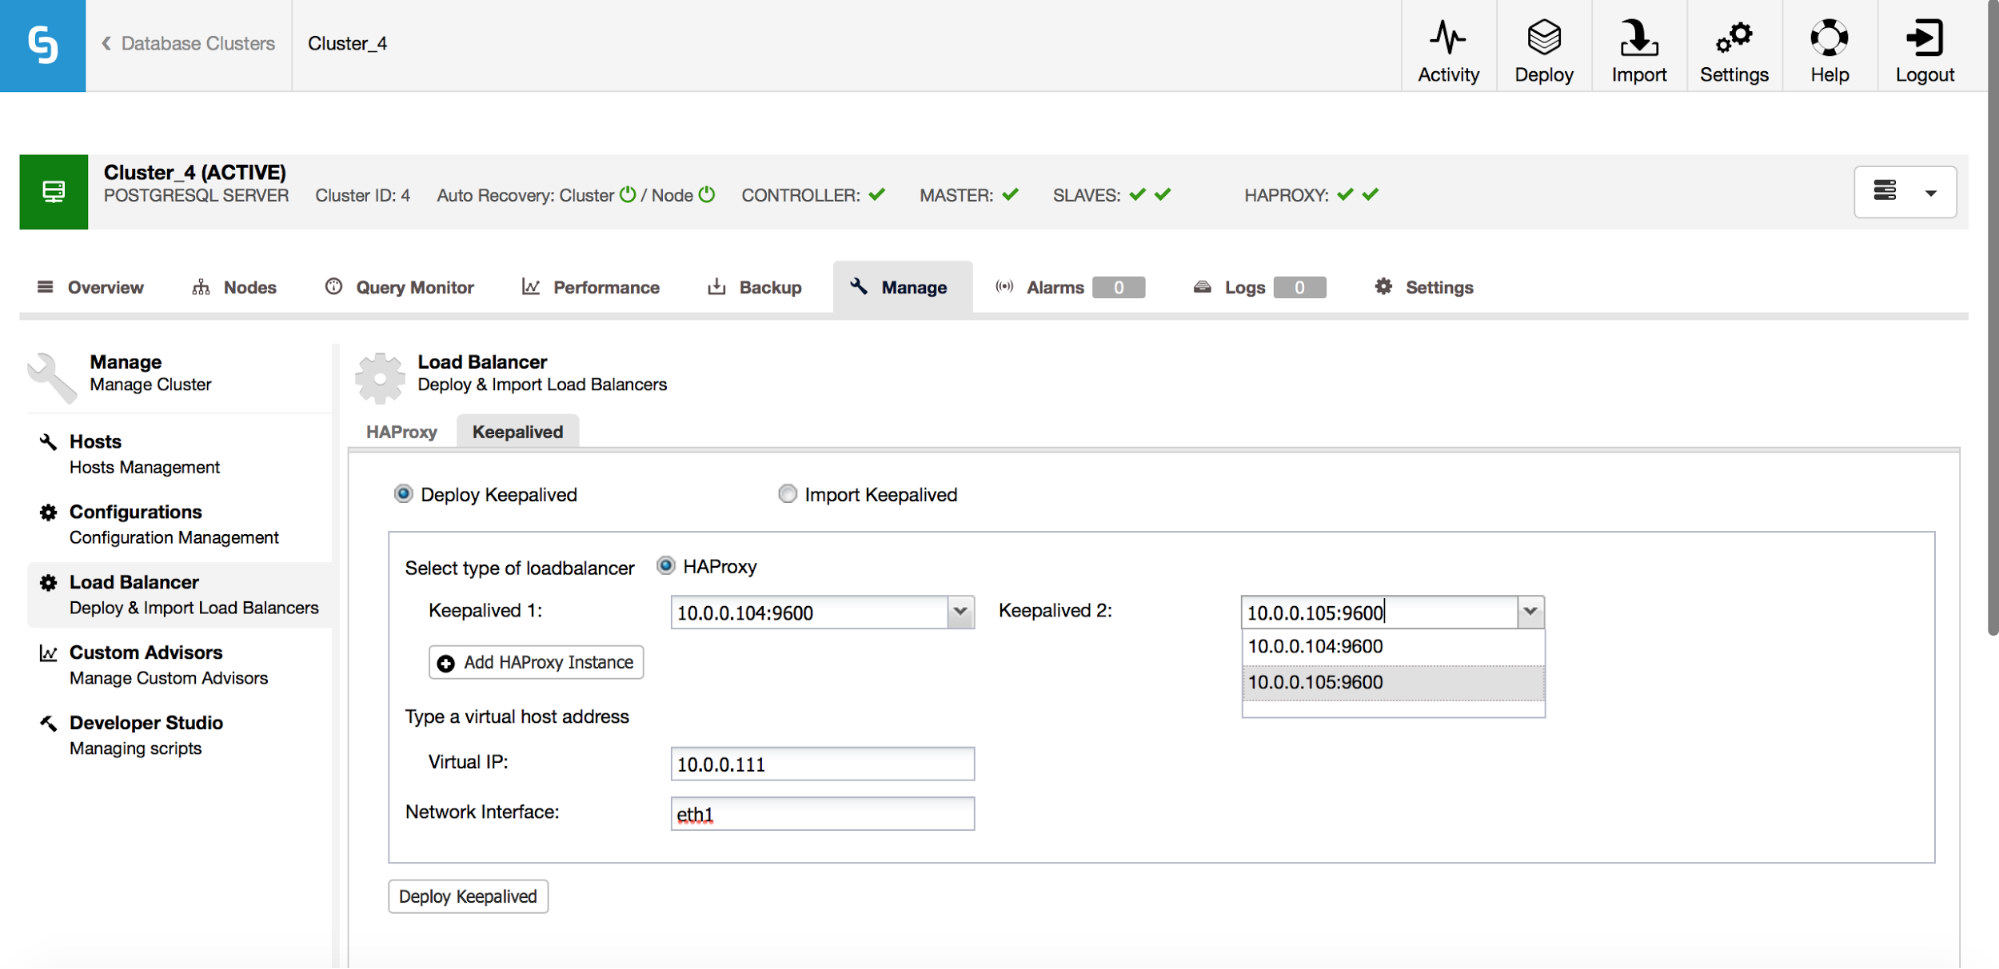
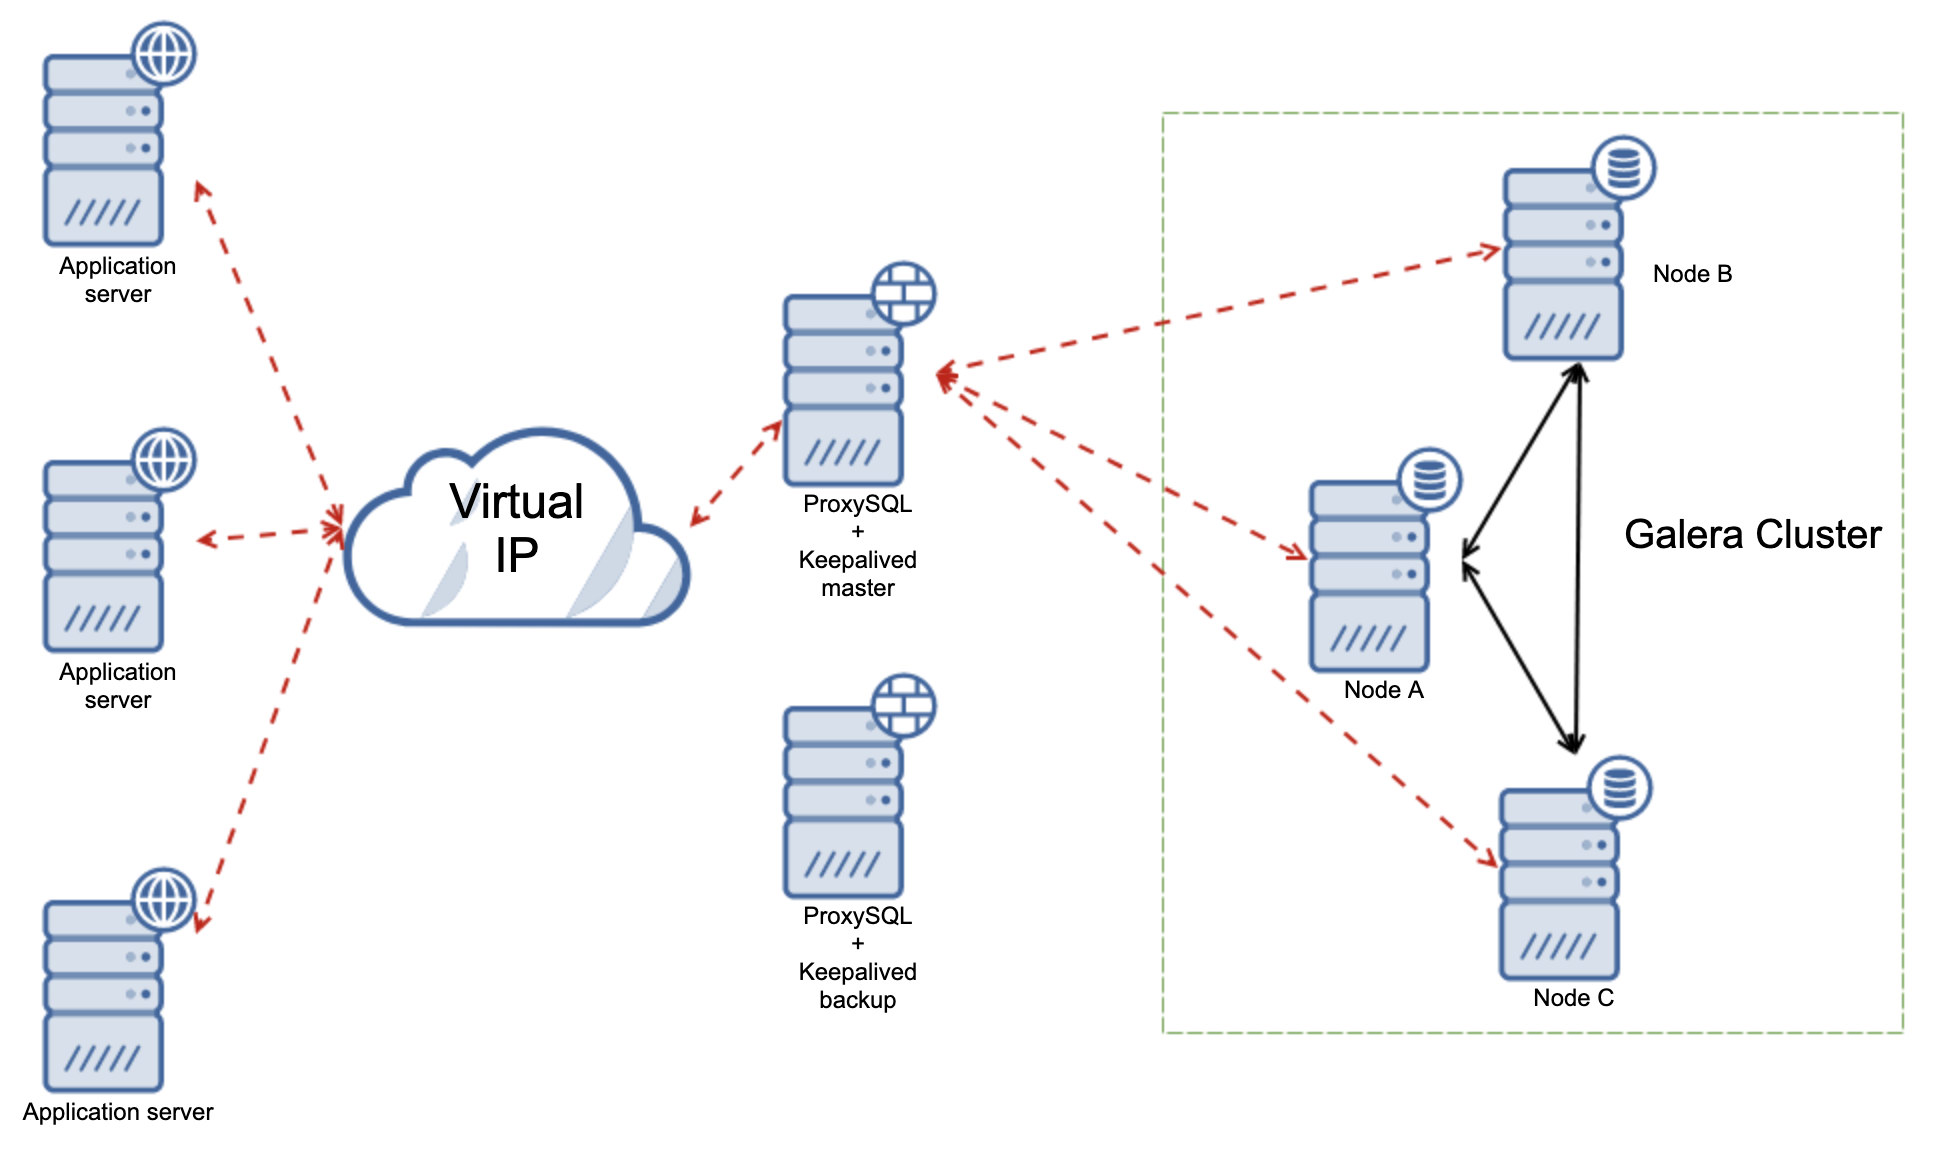
Deploying a secondary HAProxy node
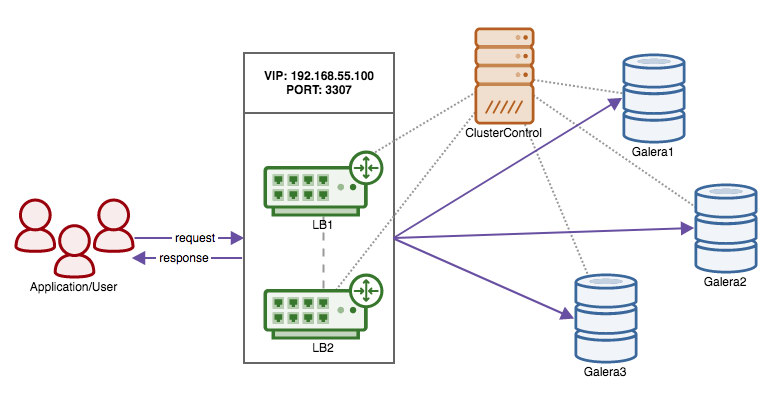
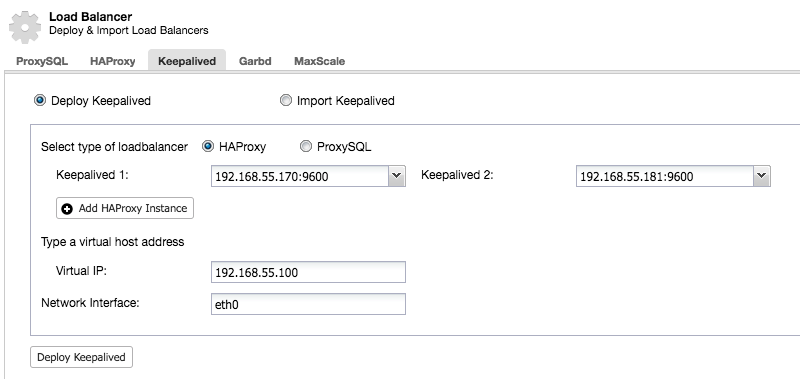
Now that we have moved the responsibility of retaining high availability over the database connections from the client to HAProxy, what if the proxy node dies? The answer is to create another HAProxy instance and use a virtual IP controlled by Keepalived as shown in this diagram:

The benefit compared to using virtual IPs on the database nodes is that the logic for MySQL is at the proxy level and the failover for the proxies is simple.
So let’s deploy a secondary HAProxy node:

After we have deployed a secondary HAProxy node, we need to add Keepalived:

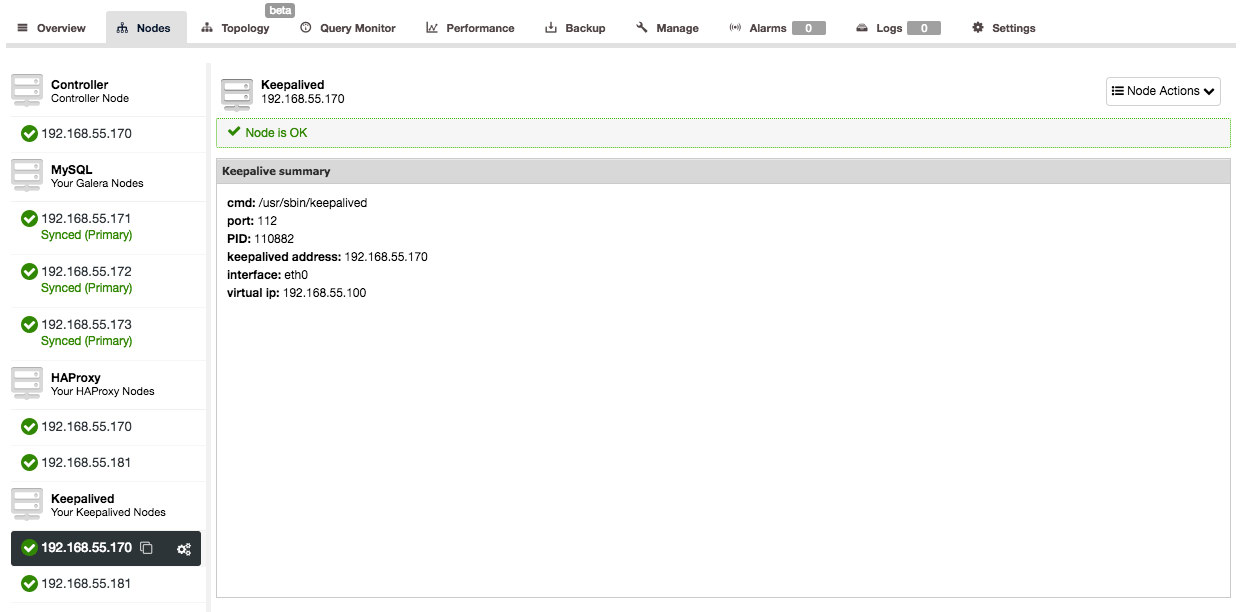
And after Keepalived has been added, your nodes overview will look like this:

So now instead of pointing your application connections to the HAProxy node directly you have to point them to the virtual IP instead.
In the example here, we used separate hosts to run HAProxy on, but you could easily add them to existing server instances as well. HAProxy does not bring much overhead, although you should keep in mind that in case of a server failure, you will lose both the database node and the proxy.
Deploying MaxScale
Deploying MaxScale to your cluster is done in a similar way to HAProxy: ‘Add Load Balancer’ in the cluster list.

ClusterControl will deploy MaxScale with both the round-robin router and the read/write splitter. The CLI port will be used to enable you to administrate MaxScale from ClusterControl.
After MaxScale has been deployed, it will be available under the Nodes tab:

Opening the MaxScale node overview will present you the interface that grants you access to the CLI interface, so there is no reason to log into MaxScale on the node anymore.
For MaxScale, the grants are slightly different: as you are proxying, you need to allow connections from the proxy - just like with HAProxy. But since MaxScale is also performing local authentication and authorization, you need to grant access to your application hosts as well.
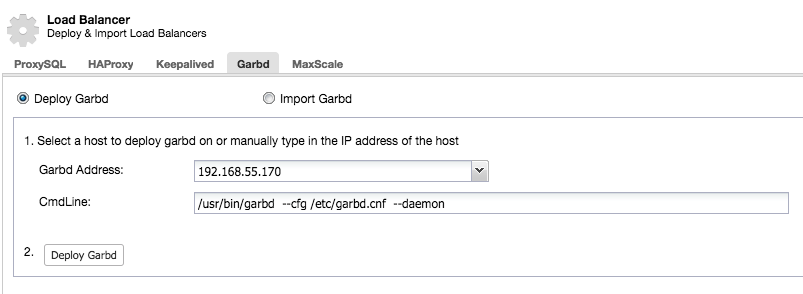
Deploying Garbd
Galera implements a quorum-based algorithm to select a primary component through which it enforces consistency. The primary component needs to have a majority of votes (50% + 1 node), so in a 2 node system, there would be no majority resulting in split brain. Fortunately, it is possible to add a garbd (Galera Arbitrator Daemon), which is a lightweight stateless daemon that can act as the odd node. The added benefit by adding the Galera Arbitrator is that you can now do with only two nodes in your cluster.
If ClusterControl detects that your Galera cluster consists of an even number of nodes, you will be given the warning/advice by ClusterControl to extend the cluster to an odd number of nodes:

Choose wisely the host to deploy garbd on, as it will receive all replicated data. Make sure the network can handle the traffic and is secure enough. You could choose one of the HAProxy or MaxScale hosts to deploy garbd on, like in the example below:

Alternatively you could install garbd on the ClusterControl host.
After installing garbd, you will see it appear next to your two Galera nodes:

Final thoughts
We showed you how to make your MySQL master-slave and Galera cluster setups more robust and retain high availability using HAProxy and MaxScale. Also garbd is a nice daemon that can save the extra third node in your Galera cluster.
This finalizes the deployment side of ClusterControl. In our next blog, we will show you how to integrate ClusterControl within your organization by using groups and assigning certain roles to users.