Quantcast
Channel: Severalnines - load balancing
Viewing all 98 articles
Browse latest View live

Database-Aware Load Balancing: How to Migrate from HAProxy to ProxySQL

$
0
0

HAProxy and ProxySQL are both very popular load balancers in MySQL world, but there is a significant difference between both those proxies. We will not go into details here, you can read more about HAProxy in HAProxy Tutorial and ProxySQL in ProxySQL Tutorial. The most important difference is that ProxySQL is SQL-aware proxy, it parses the traffic and understands MySQL protocol and, as such, it can be used for advanced traffic shaping - you can block queries, rewrite them, direct them to particular hosts, cache them and many more. HAProxy, on the other hand, is a very simple yet efficient layer 4 proxy and all it does is to send packets to backend. ProxySQL can be used to perform a read-write split - it understands the SQL and it can be configured to detect if a query is SELECT or not and route them accordingly: SELECTs to all nodes, other queries to master only. This feature is unavailable in HAProxy, which has to use two separate  ports and two separate backends for master and slaves - the read-write split has to be performed on the application side.

Why Migrate to ProxySQL?

Based on the differences we explained above, we would say that the main reason why you might want to switch from HAProxy to ProxySQL is because of the lack of the read-write split in HAProxy. If you use a cluster of MySQL databases, and it doesn’t really matter if it is asynchronous replication or Galera Cluster, you probably want to be able to split reads from writes. For MySQL replication, obviously, this would be the only way to utilize your database cluster as writes always have to be sent to the master. Therefore if you cannot do the read-write split, you can only send queries to the master only. For Galera read-write split is not a must-have but definitely a good-to-have. Sure, you can configure all Galera nodes as one backend in HAProxy and send traffic to all of them in round-robin fashion but this may result in writes from multiple nodes conflicting with each other, leading to deadlocks and performance drop. We have also seen issues and bugs within Galera cluster, for which, until they have been fixed, the workaround was to direct all the writes to a single node. Thus, the best practice is to send all the writes to one Galera node as this leads to more stable behavior and better performance.

Another very good reason for migration to ProxySQL is a need to have better control over the traffic. With HAProxy you cannot do anything - it just sends the traffic to its backends. With ProxySQL you can shape your traffic using query rules (matching traffic using regular expressions, user, schema, source host and many more). You can redirect OLAP SELECTs to analytics slave (it is true for both replication and Galera). You can offload your master by redirecting some of the SELECTs off it. You can implement SQL firewall. You can add a delay to some of the queries, you can kill queries if they take more than a predefined time. You can rewrite queries to add optimizer hints. All those are not possible with HAProxy.

How to Migrate From HAProxy to ProxySQL?

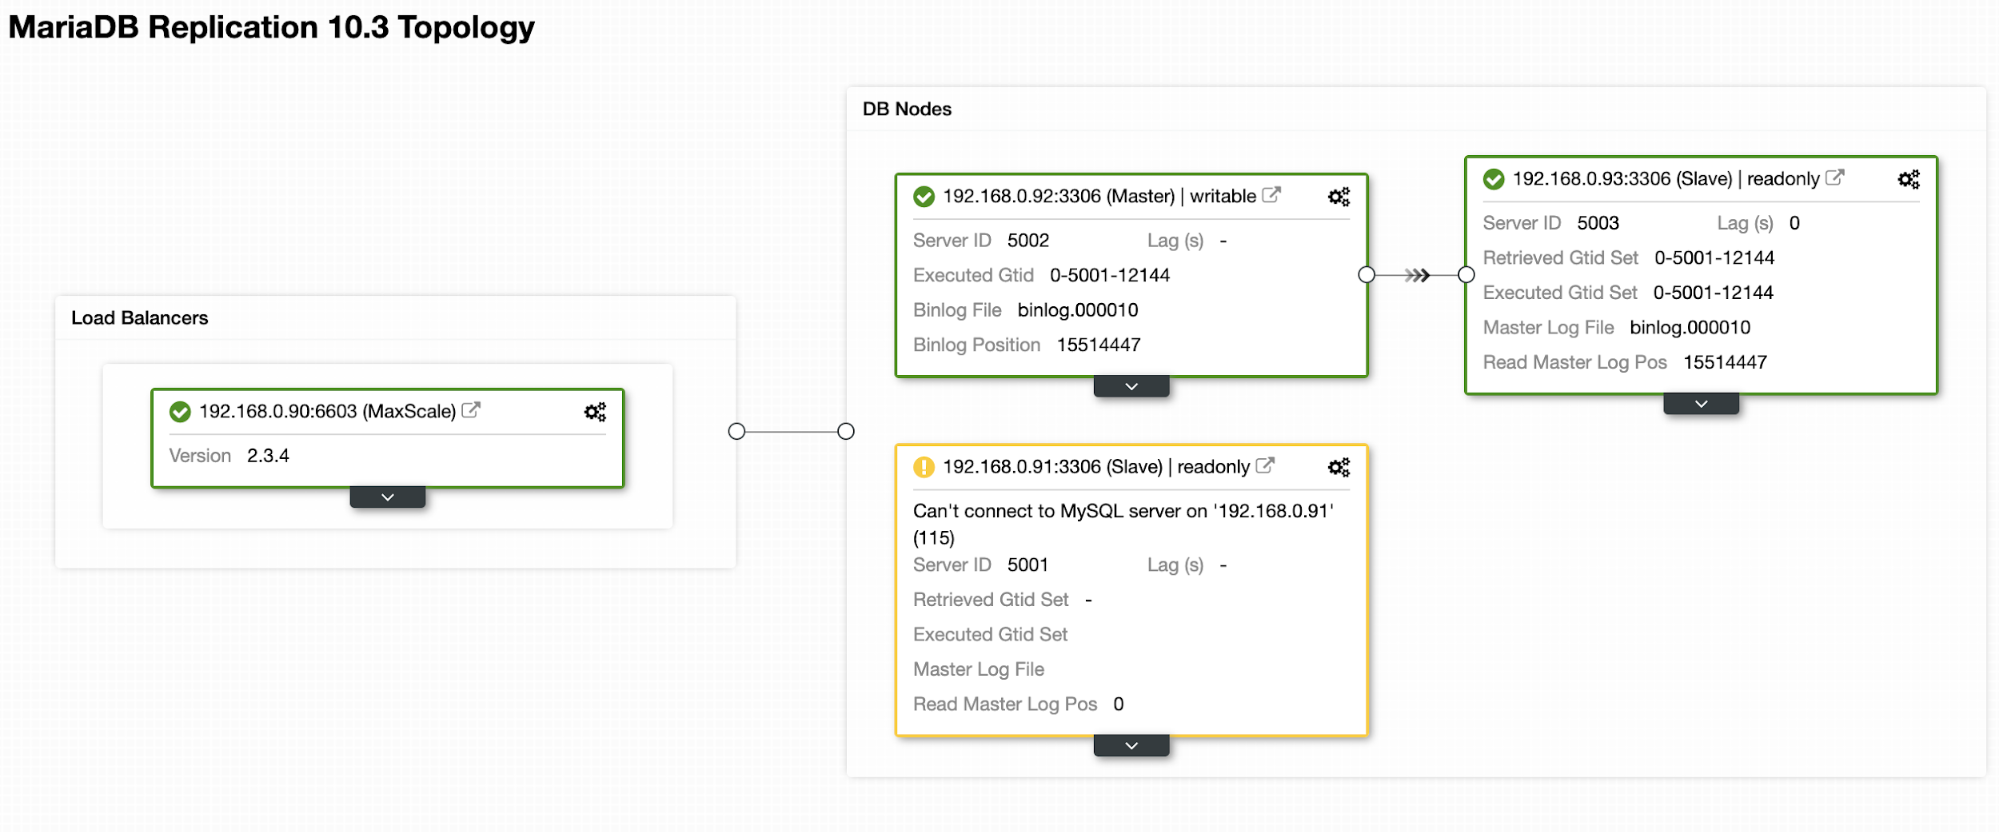
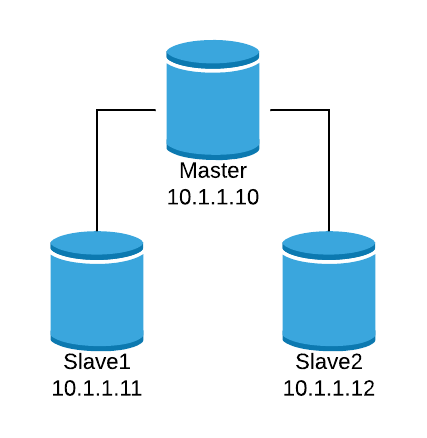
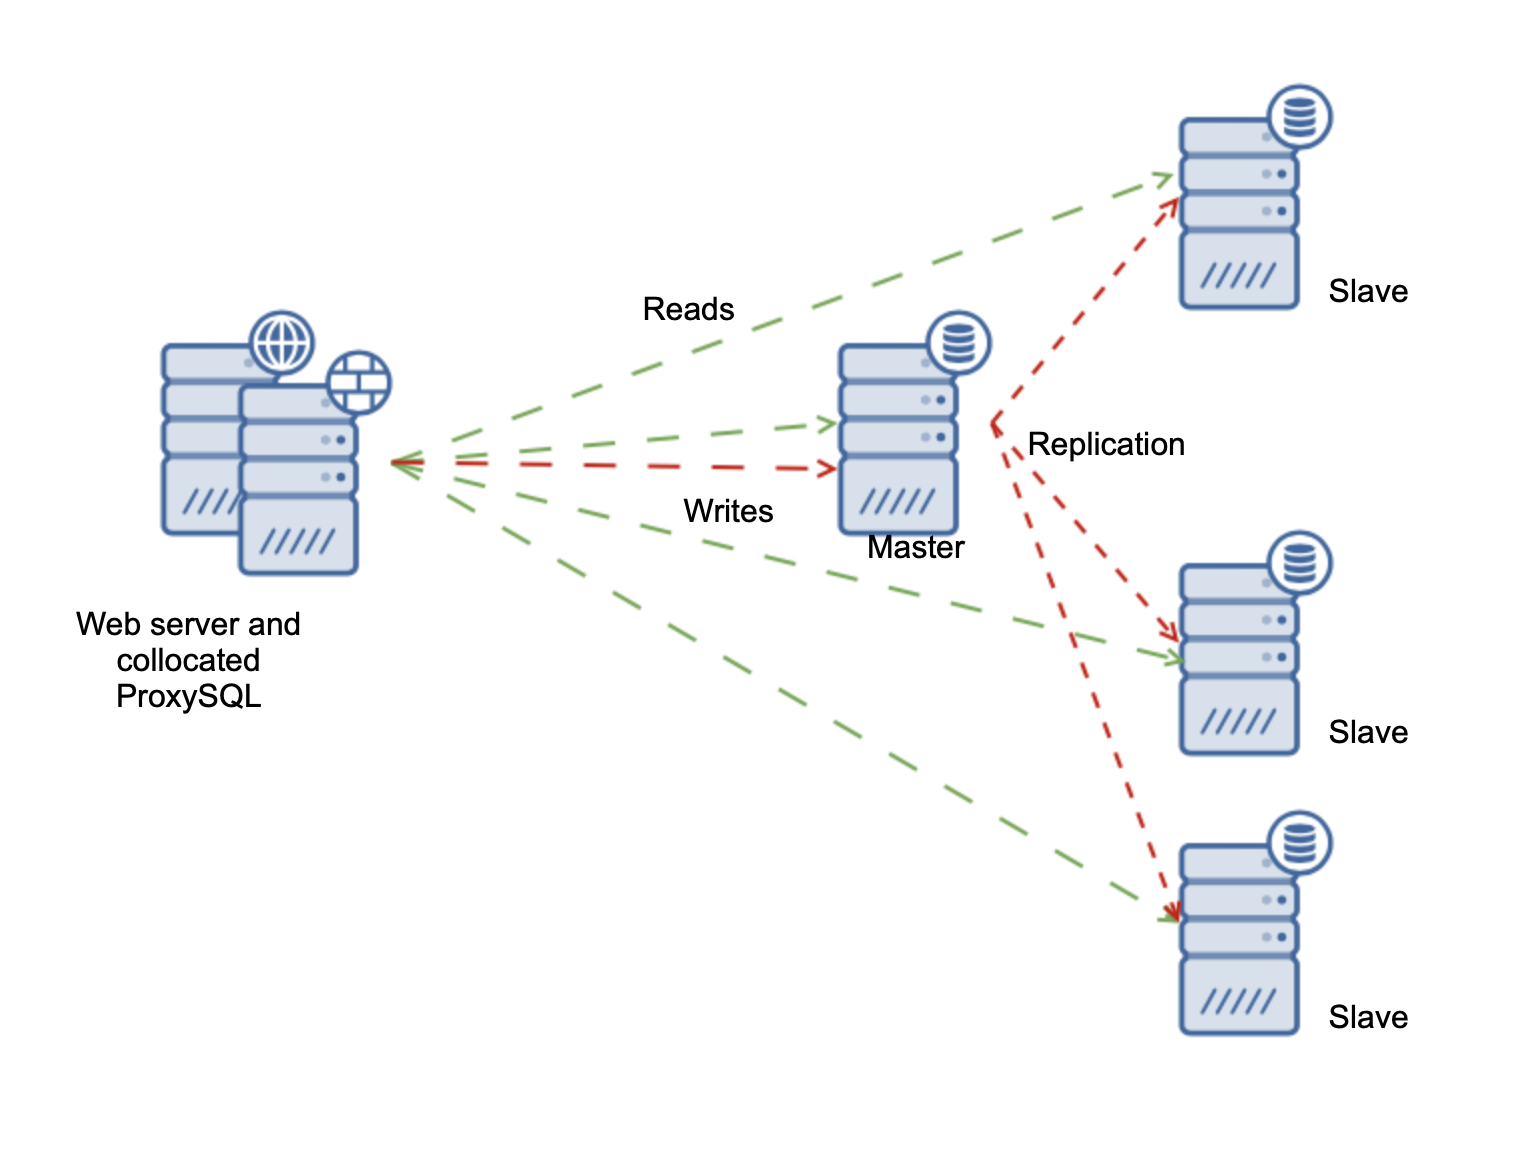
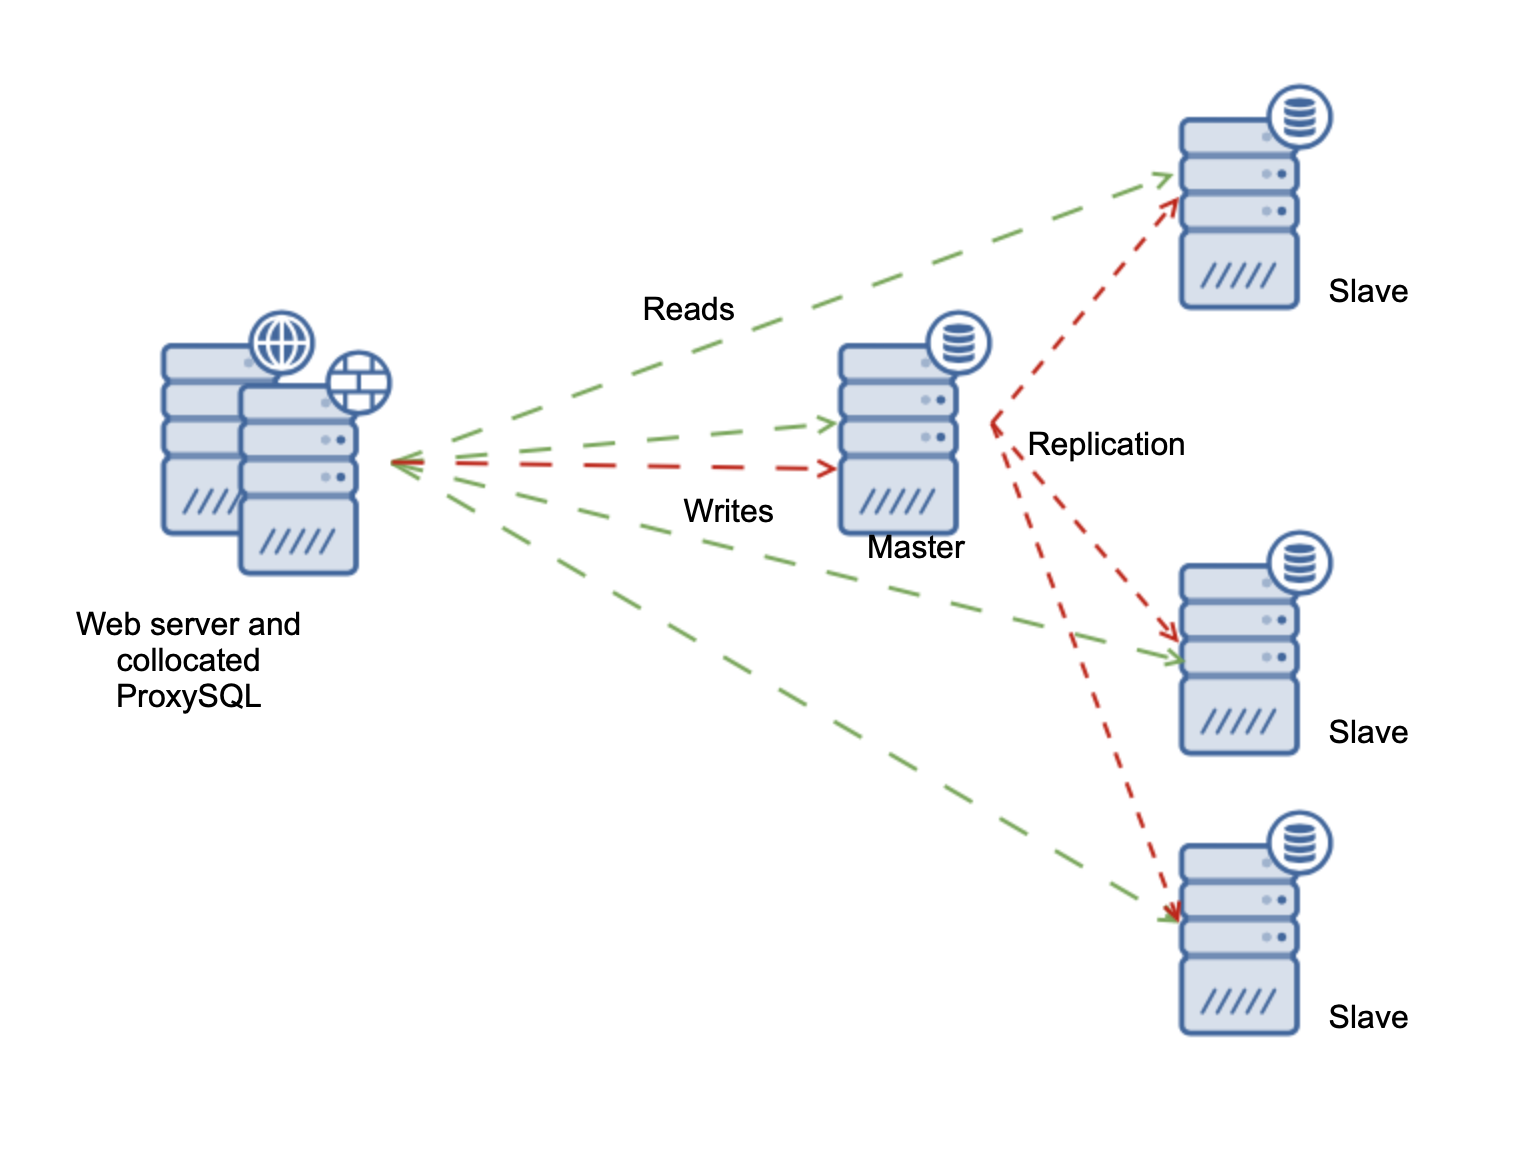
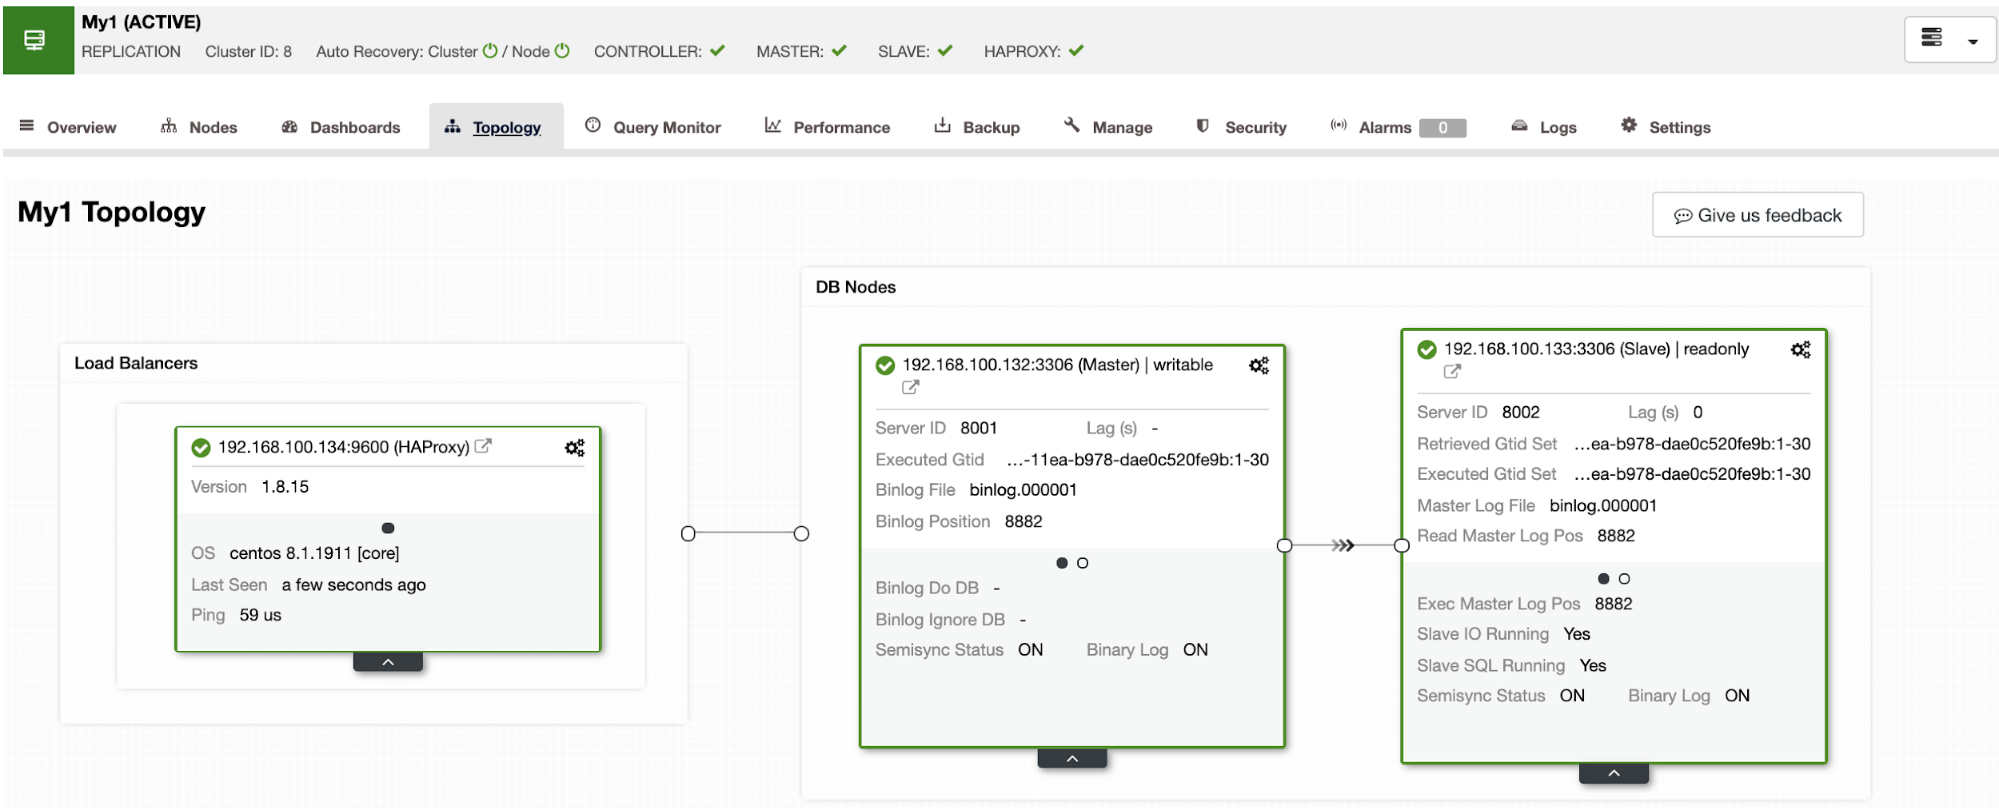
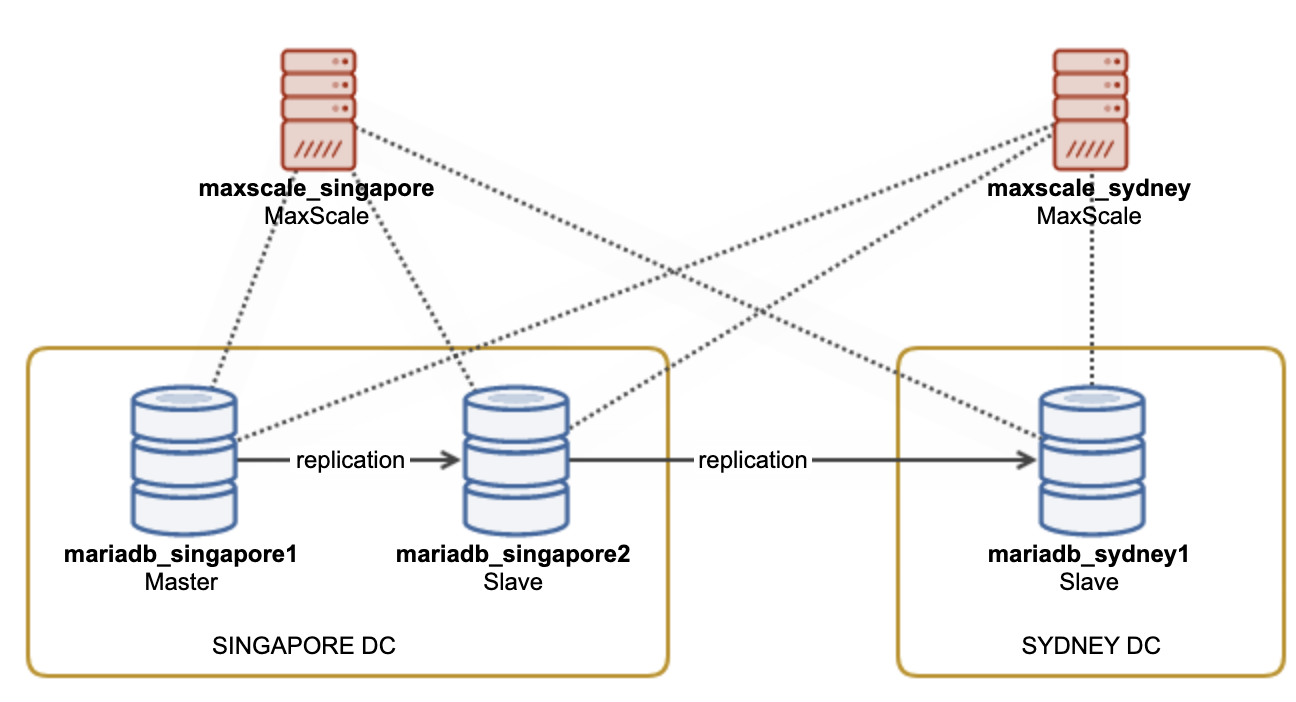
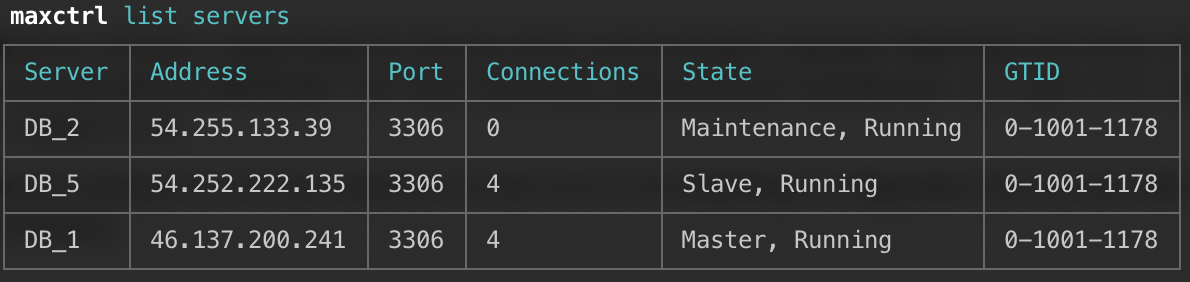
First, let’s consider the following topology...

ClusterControl MySQL Topology
MySQL Replication Cluster in ClusterControl

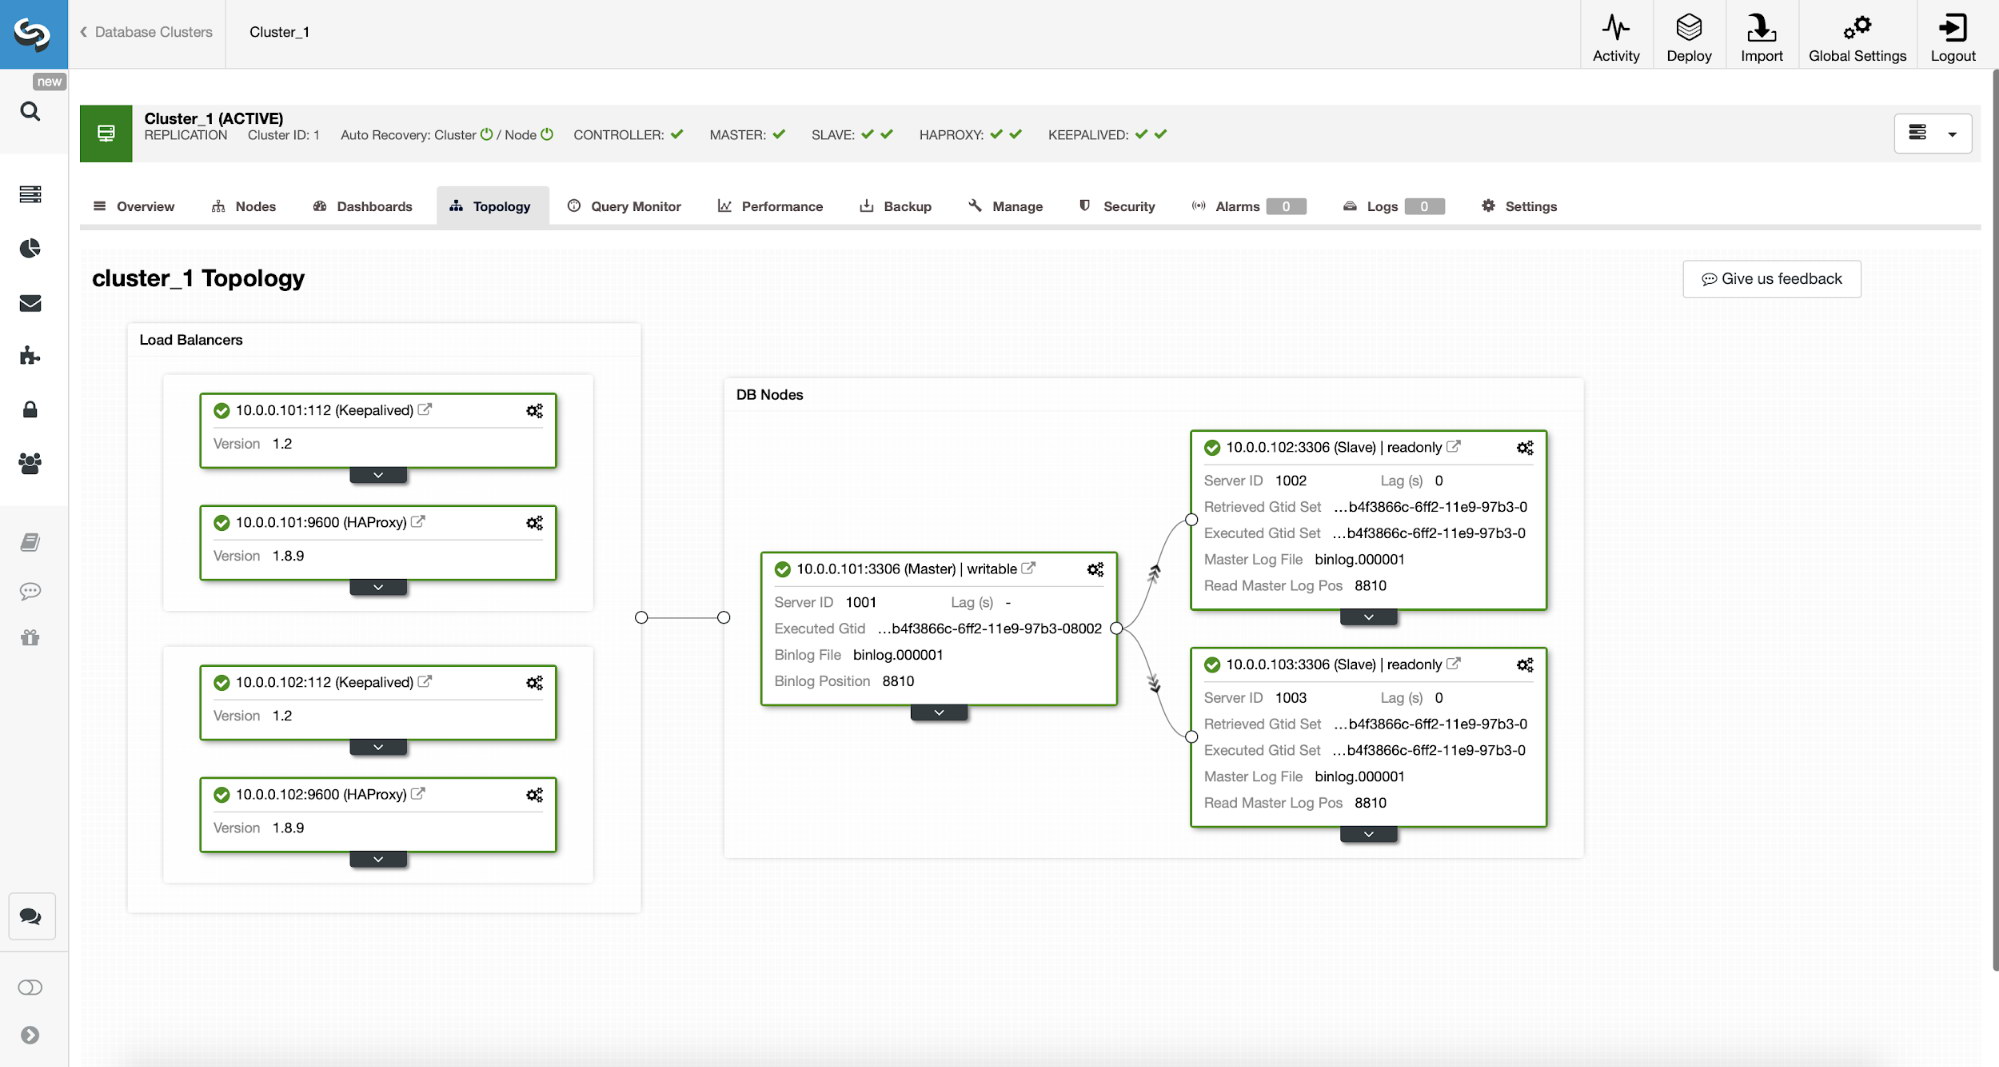
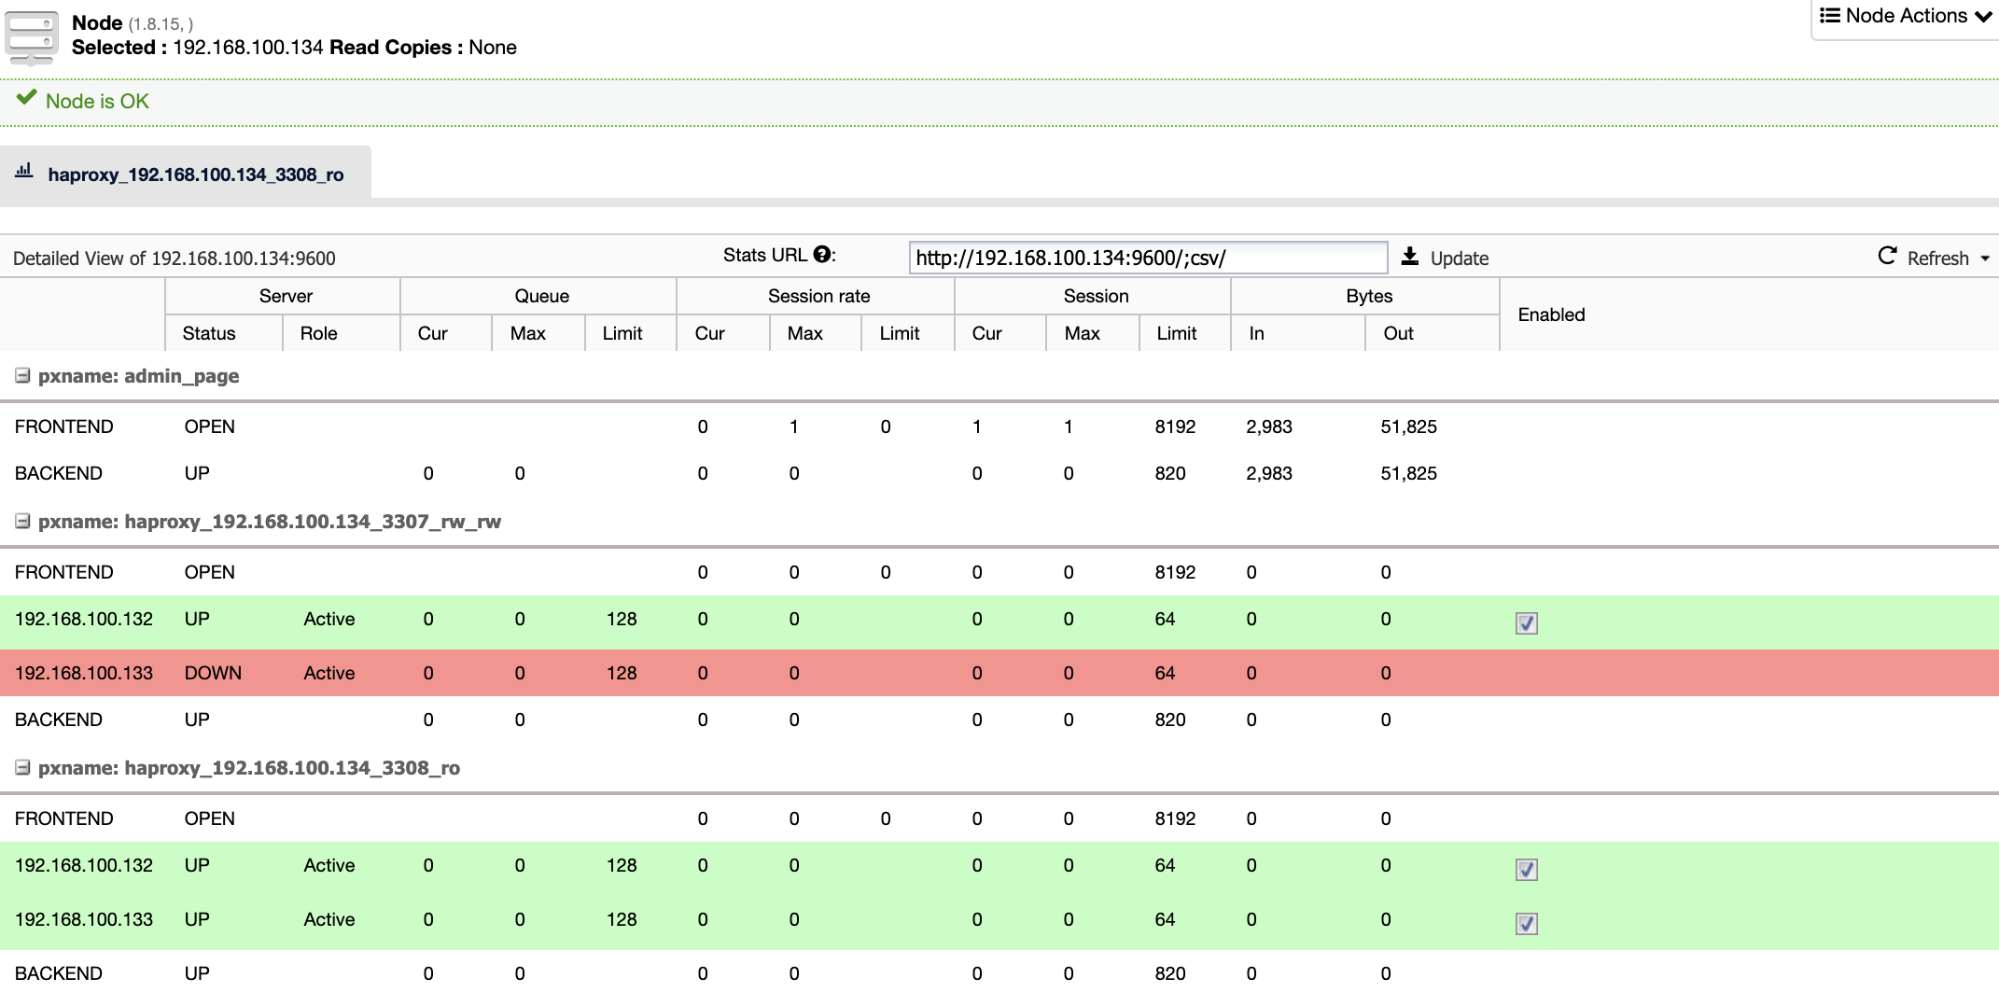
We have here a replication cluster consisting of a master and two slaves. We have two HAProxy nodes deployed, each use two backends - on port 3307 for master (writes) and 3308 for all nodes (reads). Keepalived is used to provide a Virtual IP across those two HAProxy instances - should one of them fail, another one will be used. Our application connects directly to the VIP, through it to one of the HAProxy instances. Let’s assume our application (we will use Sysbench) cannot do the read-write split therefore we have to connect to the “writer” backend. As a result, the majority of the load is on our master (10.0.0.101).

What would be the steps to migrate to ProxySQL? Let’s think about it for a moment. First, we have to deploy and configure ProxySQL. We will have to add servers to ProxySQL, create required monitoring users and create proper query rules. Finally, we will have to deploy Keepalived on top of ProxySQL, create another Virtual IP and then ensure as seamless switch as possible for our application from HAProxy to ProxySQL .

Let’s take a look at how we can accomplish that...

How to Install ProxySQL

One can install ProxySQL in many ways. You can use repository, either from ProxySQL itself (https://repo.proxysql.com) or if you happen to use Percona XtraDB Cluster, you may also install ProxySQL from Percona repository although it may require some additional configuration as it relies on CLI admin tools created for PXC. Given we are talking about replication, using them may just make things more complex. Finally, you can as well install ProxySQL binaries after you download them from ProxySQL GitHub. Currently there are two stable versions, 1.4.x and 2.0.x. There are differences between ProxySQL 1.4 and ProxySQL 2.0 in terms of features, for this blog we will stick to the 1.4.x branch, as it is better tested and the feature set is enough for us.

We will use ProxySQL repository and we will deploy ProxySQL on two additional nodes: 10.0.0.103 and 10.0.0.104.

First, we’ll install ProxySQL using the official repository. We will also ensure that MySQL client is installed (we will use it to configure ProxySQL). Please keep in mind that the process we go through is not production-grade. For production you will want to at least change default credentials for the administrative user. You will also want to review the configuration and ensure it is in line with your expectations and requirements.

apt-get install -y lsb-release
wget -O - 'https://repo.proxysql.com/ProxySQL/repo_pub_key' | apt-key add -
echo deb https://repo.proxysql.com/ProxySQL/proxysql-1.4.x/$(lsb_release -sc)/ ./ | tee /etc/apt/sources.list.d/proxysql.list
apt-get -y update
apt-get -y install proxysql
service proxysql start

Now, as ProxySQL has been started, we will use the CLI to configure ProxySQL.

mysql -uadmin -padmin -P6032 -h127.0.0.1

First, we will define backend servers and replication hostgroups:

mysql> INSERT INTO mysql_servers (hostgroup_id, hostname) VALUES (10, '10.0.0.101'), (20, '10.0.0.102'), (20, '10.0.0.103');
Query OK, 3 rows affected (0.91 sec)
mysql> INSERT INTO mysql_replication_hostgroups (writer_hostgroup, reader_hostgroup) VALUES (10, 20);
Query OK, 1 row affected (0.00 sec)

We have three servers, we also defined that ProxySQL should use hostgroup 10 for master (node with read_only=0) and hostgroup 20 for slaves (read_only=1).

As next step, we need to add a monitoring user on the MySQL nodes so that ProxySQL could monitor them. We’ll go with defaults, ideally you will change the credentials in ProxySQL.

mysql> SHOW VARIABLES LIKE 'mysql-monitor_username';
+------------------------+---------+
| Variable_name          | Value   |
+------------------------+---------+
| mysql-monitor_username | monitor |
+------------------------+---------+
1 row in set (0.00 sec)
mysql> SHOW VARIABLES LIKE 'mysql-monitor_password';
+------------------------+---------+
| Variable_name          | Value   |
+------------------------+---------+
| mysql-monitor_password | monitor |
+------------------------+---------+
1 row in set (0.00 sec)

So, we need to create user ‘monitor’ with password ‘monitor’. To do that we will need to execute following grant on the master MySQL server:

mysql> create user monitor@'%' identified by 'monitor';
Query OK, 0 rows affected (0.56 sec)

Back to ProxySQL - we have to configure users that our application will use to access MySQL and query rules, which are intended to give us a read-write split.

mysql> INSERT INTO mysql_users (username, password, default_hostgroup) VALUES ('sbtest', 'sbtest', 10);
Query OK, 1 row affected (0.34 sec)
mysql> INSERT INTO mysql_query_rules (rule_id,active,match_digest,destination_hostgroup,apply) VALUES (100, 1, '^SELECT.*FOR UPDATE$',10,1), (200,1,'^SELECT',20,1), (300,1,'.*',10,1);
Query OK, 3 rows affected (0.01 sec)

Please note that we used password in the plain text and we will rely on ProxySQL to hash it. For the sake of security you should explicitly pass here the MySQL password hash.

Finally, we need to apply all the changes.

mysql> LOAD MYSQL SERVERS TO RUNTIME;
Query OK, 0 rows affected (0.02 sec)
mysql> LOAD MYSQL USERS TO RUNTIME;
Query OK, 0 rows affected (0.01 sec)
mysql> LOAD MYSQL QUERY RULES TO RUNTIME;
Query OK, 0 rows affected (0.01 sec)
mysql> SAVE MYSQL SERVERS TO DISK;
Query OK, 0 rows affected (0.07 sec)
mysql> SAVE MYSQL QUERY RULES TO DISK;
Query OK, 0 rows affected (0.02 sec)

We also want to load the hashed passwords from runtime: plain text passwords are hashed when loaded into the runtime configuration, to keep it hashed on disk we need to load it from runtime and then store on disk:

mysql> SAVE MYSQL USERS FROM RUNTIME;
Query OK, 0 rows affected (0.00 sec)
mysql> SAVE MYSQL USERS TO DISK;
Query OK, 0 rows affected (0.02 sec)

This is it when it comes to ProxySQL. Before making further steps you should check if you can connect to proxies from your application servers.

root@vagrant:~# mysql -h 10.0.0.103 -usbtest -psbtest -P6033 -e "SELECT * FROM sbtest.sbtest4 LIMIT 1\G"
mysql: [Warning] Using a password on the command line interface can be insecure.
*************************** 1. row ***************************
 id: 1
  k: 50147
  c: 68487932199-96439406143-93774651418-41631865787-96406072701-20604855487-25459966574-28203206787-41238978918-19503783441
pad: 22195207048-70116052123-74140395089-76317954521-98694025897

In our case, everything looks good. Now it’s time to install Keepalived.

Keepalived installation

Installation is quite simple (at least on Ubuntu 16.04, which we used):

apt install keepalived

Then you have to create configuration files for both servers:

Master keepalived node:

vrrp_script chk_haproxy {
   script "killall -0 haproxy"   # verify the pid existance
   interval 2                    # check every 2 seconds
   weight 2                      # add 2 points of prio if OK
}
vrrp_instance VI_HAPROXY {
   interface eth1                # interface to monitor
   state MASTER
   virtual_router_id 52          # Assign one ID for this route
   priority 101
   unicast_src_ip 10.0.0.103
   unicast_peer {
      10.0.0.104

   }
   virtual_ipaddress {
       10.0.0.112                        # the virtual IP
   }
   track_script {
       chk_haproxy
   }
#    notify /usr/local/bin/notify_keepalived.sh
}

Backup keepalived node:

vrrp_script chk_haproxy {
   script "killall -0 haproxy"   # verify the pid existance
   interval 2                    # check every 2 seconds
   weight 2                      # add 2 points of prio if OK
}
vrrp_instance VI_HAPROXY {
   interface eth1                # interface to monitor
   state MASTER
   virtual_router_id 52          # Assign one ID for this route
   priority 100
   unicast_src_ip 10.0.0.103
   unicast_peer {
      10.0.0.104

   }
   virtual_ipaddress {
       10.0.0.112                        # the virtual IP
   }
   track_script {
       chk_haproxy
   }
#    notify /usr/local/bin/notify_keepalived.sh

This is it, you can start keepalived on both nodes:

service keepalived start

You should see information in the logs that one of the nodes entered MASTER state and that VIP has been brought up on that node.

May  7 09:52:11 vagrant systemd[1]: Starting Keepalive Daemon (LVS and VRRP)...
May  7 09:52:11 vagrant Keepalived[26686]: Starting Keepalived v1.2.24 (08/06,2018)
May  7 09:52:11 vagrant Keepalived[26686]: Opening file '/etc/keepalived/keepalived.conf'.
May  7 09:52:11 vagrant Keepalived[26696]: Starting Healthcheck child process, pid=26697
May  7 09:52:11 vagrant Keepalived[26696]: Starting VRRP child process, pid=26698
May  7 09:52:11 vagrant Keepalived_healthcheckers[26697]: Initializing ipvs
May  7 09:52:11 vagrant Keepalived_vrrp[26698]: Registering Kernel netlink reflector
May  7 09:52:11 vagrant Keepalived_vrrp[26698]: Registering Kernel netlink command channel
May  7 09:52:11 vagrant Keepalived_vrrp[26698]: Registering gratuitous ARP shared channel
May  7 09:52:11 vagrant systemd[1]: Started Keepalive Daemon (LVS and VRRP).
May  7 09:52:11 vagrant Keepalived_vrrp[26698]: Unable to load ipset library
May  7 09:52:11 vagrant Keepalived_vrrp[26698]: Unable to initialise ipsets
May  7 09:52:11 vagrant Keepalived_vrrp[26698]: Opening file '/etc/keepalived/keepalived.conf'.
May  7 09:52:11 vagrant Keepalived_vrrp[26698]: Using LinkWatch kernel netlink reflector...
May  7 09:52:11 vagrant Keepalived_healthcheckers[26697]: Registering Kernel netlink reflector
May  7 09:52:11 vagrant Keepalived_healthcheckers[26697]: Registering Kernel netlink command channel
May  7 09:52:11 vagrant Keepalived_healthcheckers[26697]: Opening file '/etc/keepalived/keepalived.conf'.
May  7 09:52:11 vagrant Keepalived_healthcheckers[26697]: Using LinkWatch kernel netlink reflector...
May  7 09:52:11 vagrant Keepalived_vrrp[26698]: pid 26701 exited with status 256
May  7 09:52:12 vagrant Keepalived_vrrp[26698]: VRRP_Instance(VI_HAPROXY) Transition to MASTER STATE
May  7 09:52:13 vagrant Keepalived_vrrp[26698]: pid 26763 exited with status 256
May  7 09:52:13 vagrant Keepalived_vrrp[26698]: VRRP_Instance(VI_HAPROXY) Entering MASTER STATE
May  7 09:52:15 vagrant Keepalived_vrrp[26698]: pid 26806 exited with status 256
root@vagrant:~# ip a
1: lo: <LOOPBACK,UP,LOWER_UP> mtu 65536 qdisc noqueue state UNKNOWN group default qlen 1
    link/loopback 00:00:00:00:00:00 brd 00:00:00:00:00:00
    inet 127.0.0.1/8 scope host lo
       valid_lft forever preferred_lft forever
    inet6 ::1/128 scope host
       valid_lft forever preferred_lft forever
2: eth0: <BROADCAST,MULTICAST,UP,LOWER_UP> mtu 1500 qdisc pfifo_fast state UP group default qlen 1000
    link/ether 08:00:27:ee:87:c4 brd ff:ff:ff:ff:ff:ff
    inet 10.0.2.15/24 brd 10.0.2.255 scope global eth0
       valid_lft forever preferred_lft forever
    inet6 fe80::a00:27ff:feee:87c4/64 scope link
       valid_lft forever preferred_lft forever
3: eth1: <BROADCAST,MULTICAST,UP,LOWER_UP> mtu 1500 qdisc pfifo_fast state UP group default qlen 1000
    link/ether 08:00:27:fc:ac:21 brd ff:ff:ff:ff:ff:ff
    inet 10.0.0.103/24 brd 10.0.0.255 scope global eth1
       valid_lft forever preferred_lft forever
    inet 10.0.0.112/32 scope global eth1
       valid_lft forever preferred_lft forever
    inet6 fe80::a00:27ff:fefc:ac21/64 scope link
       valid_lft forever preferred_lft forever

As you can see, on node 10.0.0.103 a VIP (10.0.0.112) has been raised. We can now conclude with moving the traffic from old setup into the new one.

Switching Traffic to a ProxySQL Setup

There are many methods on how to do it, it mostly depends on your particular environment. If you happen to use DNS to maintain a domain pointing to your HAProxy VIP, , you can just make a change there and, gradually, over time all connections will repoint to the new VIP. You can also make a change in your application, especially if the connection details are hardcoded - once you roll out the change, nodes will start connecting to the new setup. No matter how you do it, it would be great to test the new setup before you make a global switch. You sure tested it on your staging environment but it’s not a bad idea to pick a handful of app servers and redirect them to the new proxy, monitoring how they look like performance-wise. Below is a simple example utilizing iptables, which can be useful for testing.

On the ProxySQL hosts, redirect traffic from host 10.0.0.11 and port 3307 to host 10.0.0.112 and port 6033:

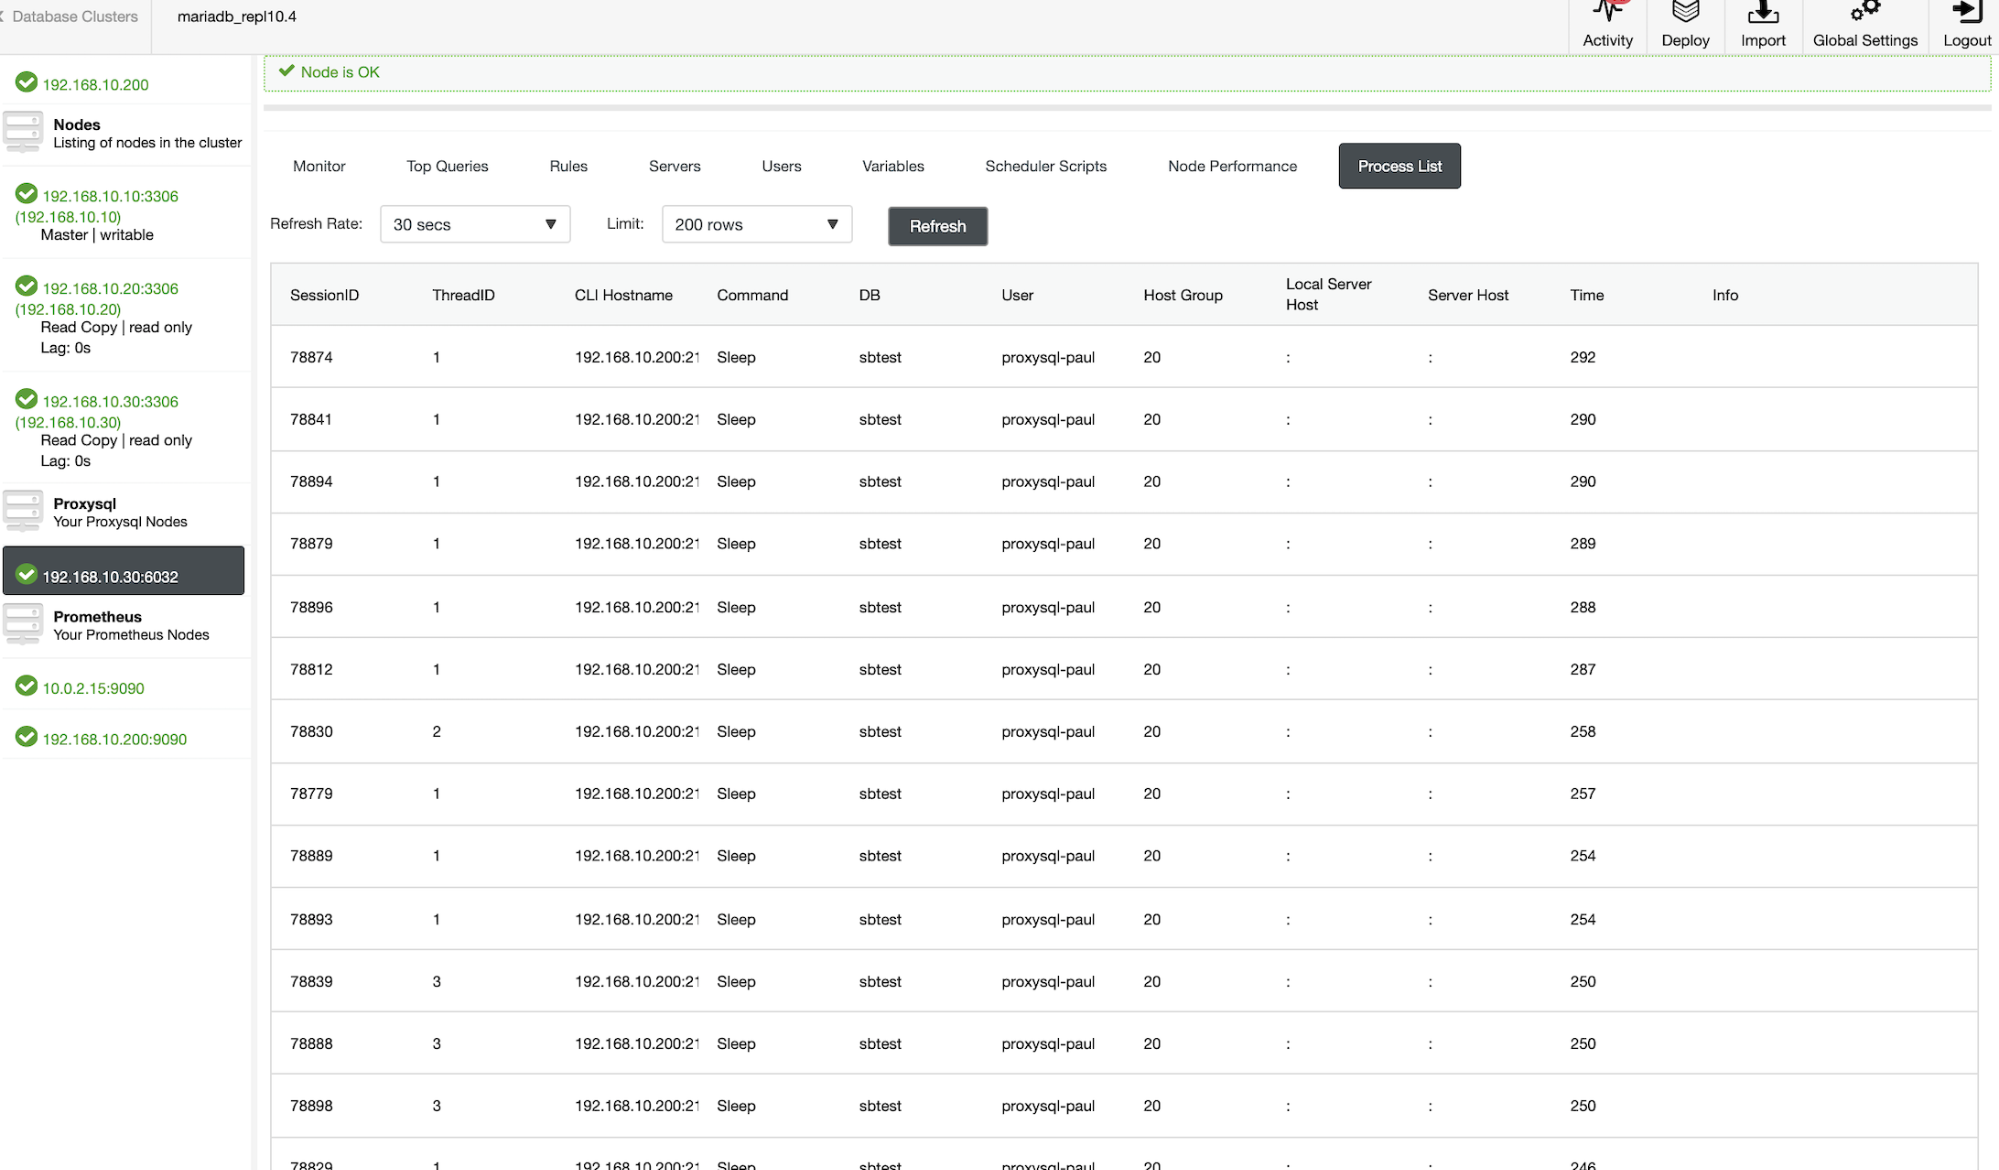
iptables -t nat -A OUTPUT -p tcp -d 10.0.0.111 --dport 3307 -j DNAT --to-destination 10.0.0.112:6033

Depending on your application you may need to restart the web server or other services (if your app creates a constant pool of connections to the database) or just wait as new connections will be opened against ProxySQL. You can verify that ProxySQL is receiving the traffic:

mysql> show processlist;
+-----------+--------+--------+-----------+---------+---------+-----------------------------------------------------------------------------+
| SessionID | user   | db     | hostgroup | command | time_ms | info                                                                        |
+-----------+--------+--------+-----------+---------+---------+-----------------------------------------------------------------------------+
| 12        | sbtest | sbtest | 20        | Sleep   | 0       |                                                                             |
| 13        | sbtest | sbtest | 10        | Query   | 0       | DELETE FROM sbtest23 WHERE id=49957                                         |
| 14        | sbtest | sbtest | 10        | Query   | 59      | DELETE FROM sbtest11 WHERE id=50185                                         |
| 15        | sbtest | sbtest | 20        | Query   | 59      | SELECT c FROM sbtest8 WHERE id=46054                                        |
| 16        | sbtest | sbtest | 20        | Query   | 0       | SELECT DISTINCT c FROM sbtest27 WHERE id BETWEEN 50115 AND 50214 ORDER BY c |
| 17        | sbtest | sbtest | 10        | Query   | 0       | DELETE FROM sbtest32 WHERE id=50084                                         |
| 18        | sbtest | sbtest | 10        | Query   | 26      | DELETE FROM sbtest28 WHERE id=34611                                         |
| 19        | sbtest | sbtest | 10        | Query   | 16      | DELETE FROM sbtest4 WHERE id=50151                                          |
+-----------+--------+--------+-----------+---------+---------+-----------------------------------------------------------------------------+

That was it, we have moved the traffic from HAProxy into ProxySQL setup. It took some steps but it is definitely doable with very small disruption to the service.

How to Migrate From HAProxy to ProxySQL Using ClusterControl?

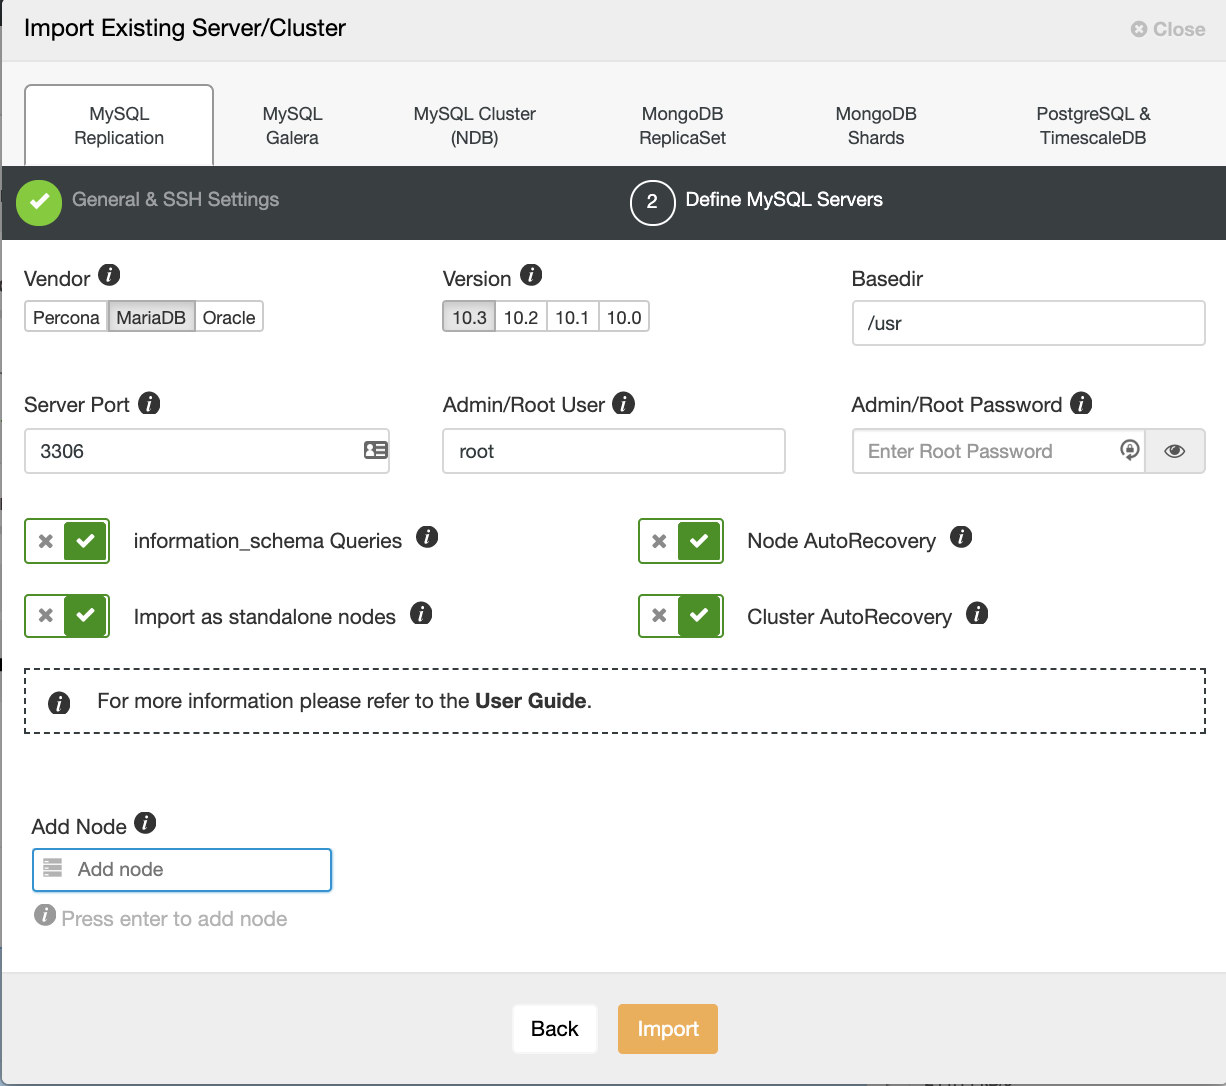
In the previous section we explained how to manually deploy ProxySQL setup and then migrate into it. In this section we would like to explain how to accomplish the same objective using ClusterControl. The initial setup is exactly the same therefore we need to proceed with deployment of ProxySQL.

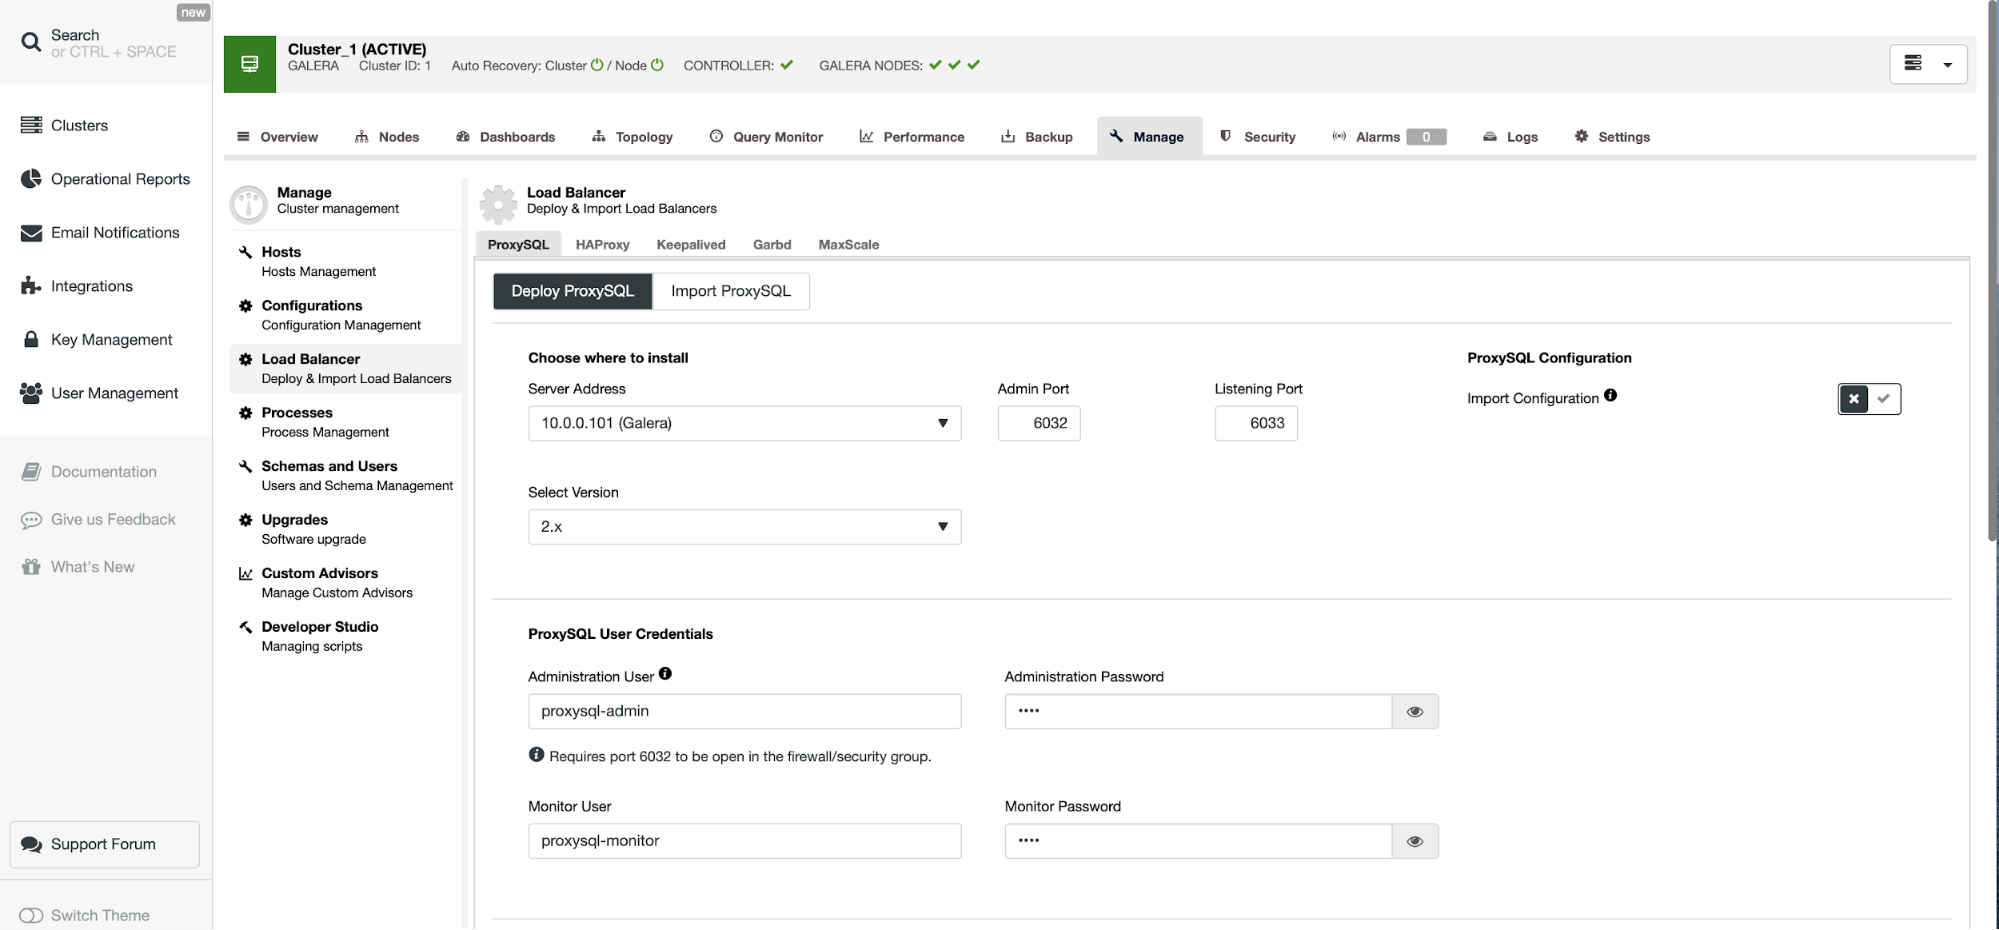
Deploying ProxySQL Using ClusterControl

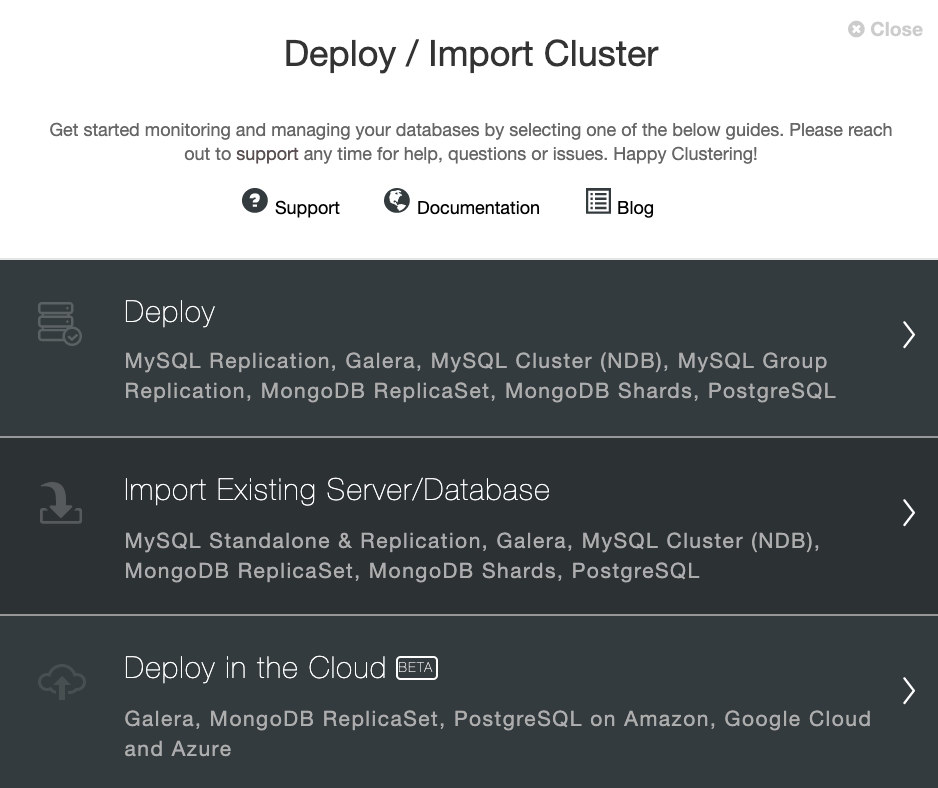
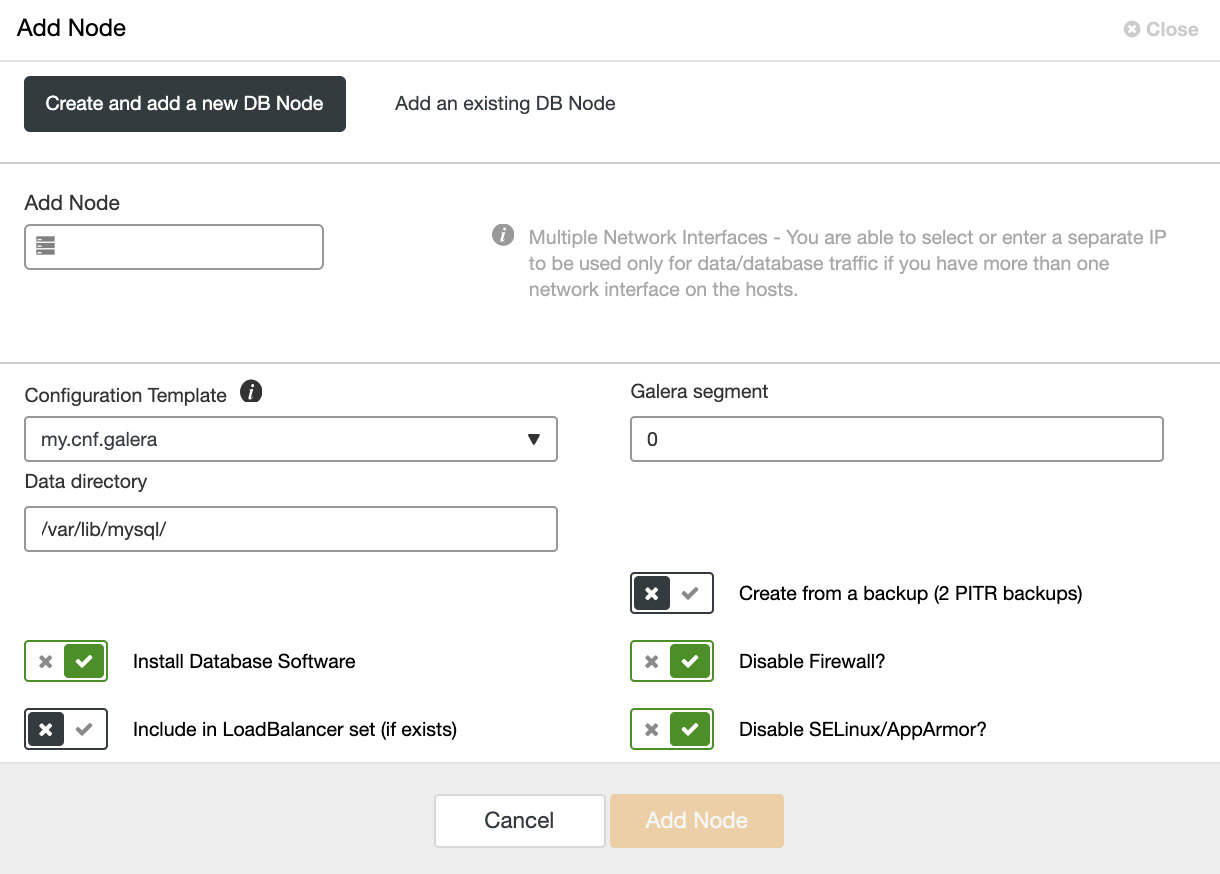
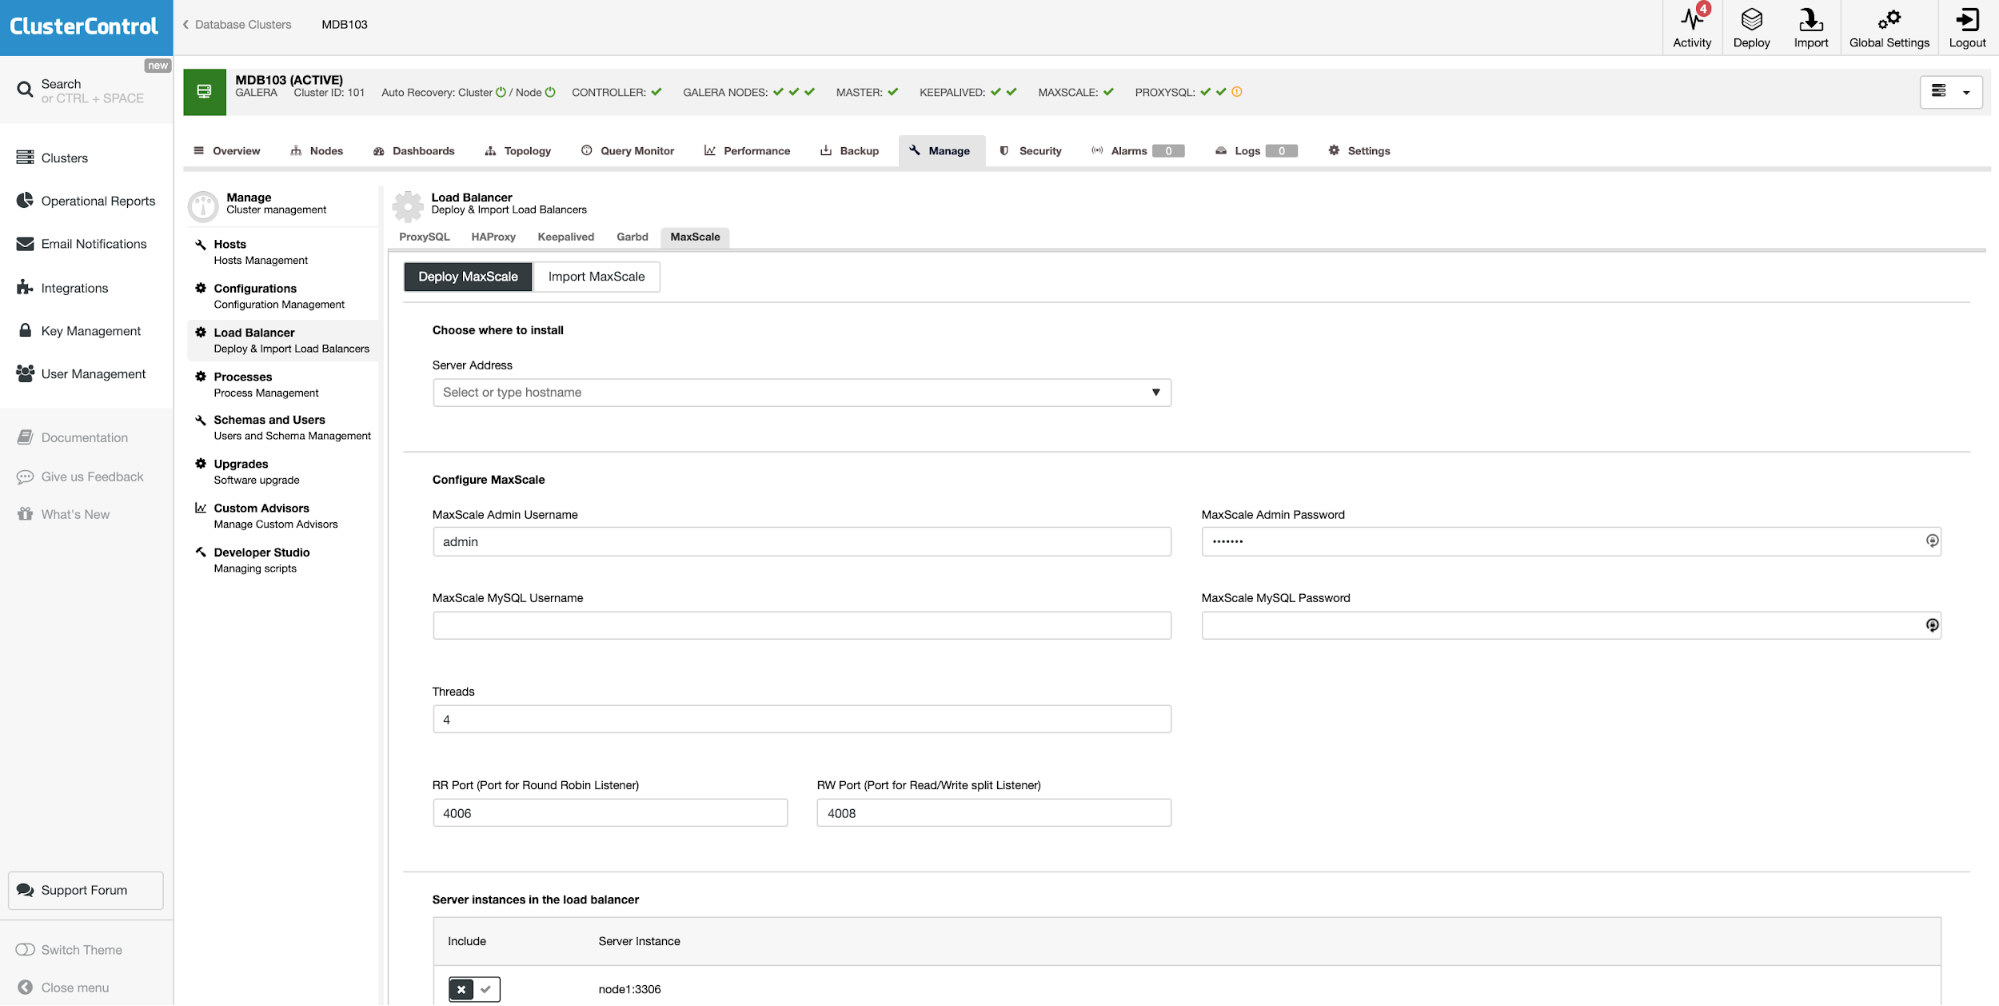
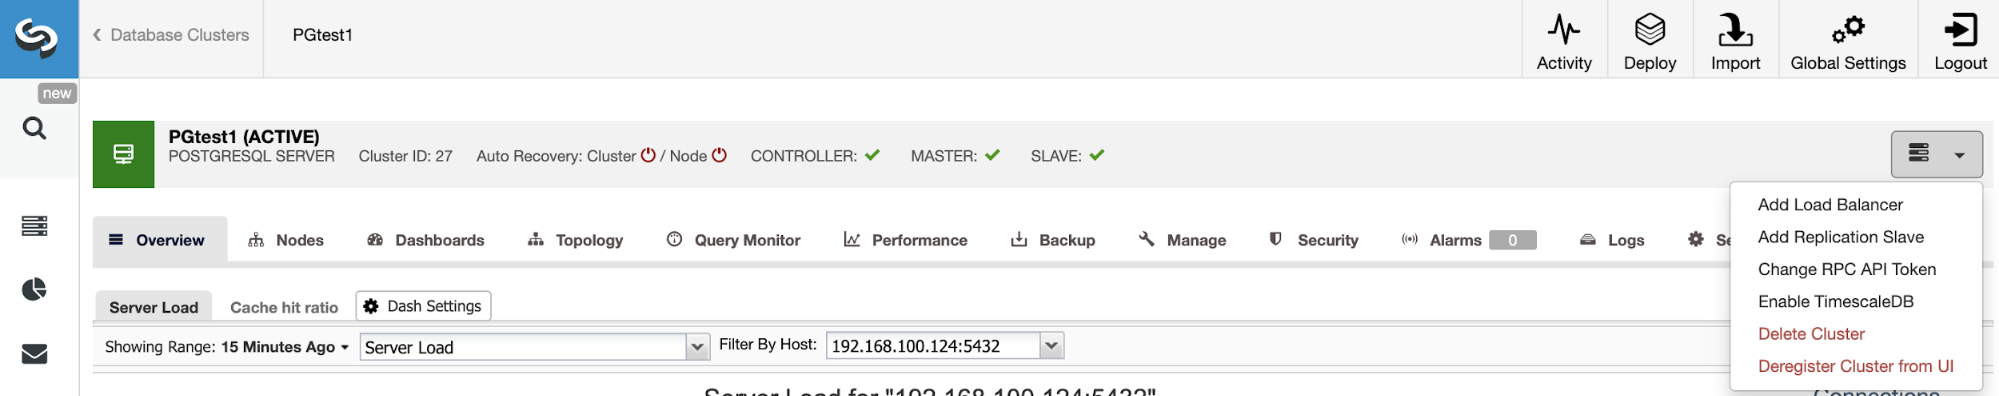
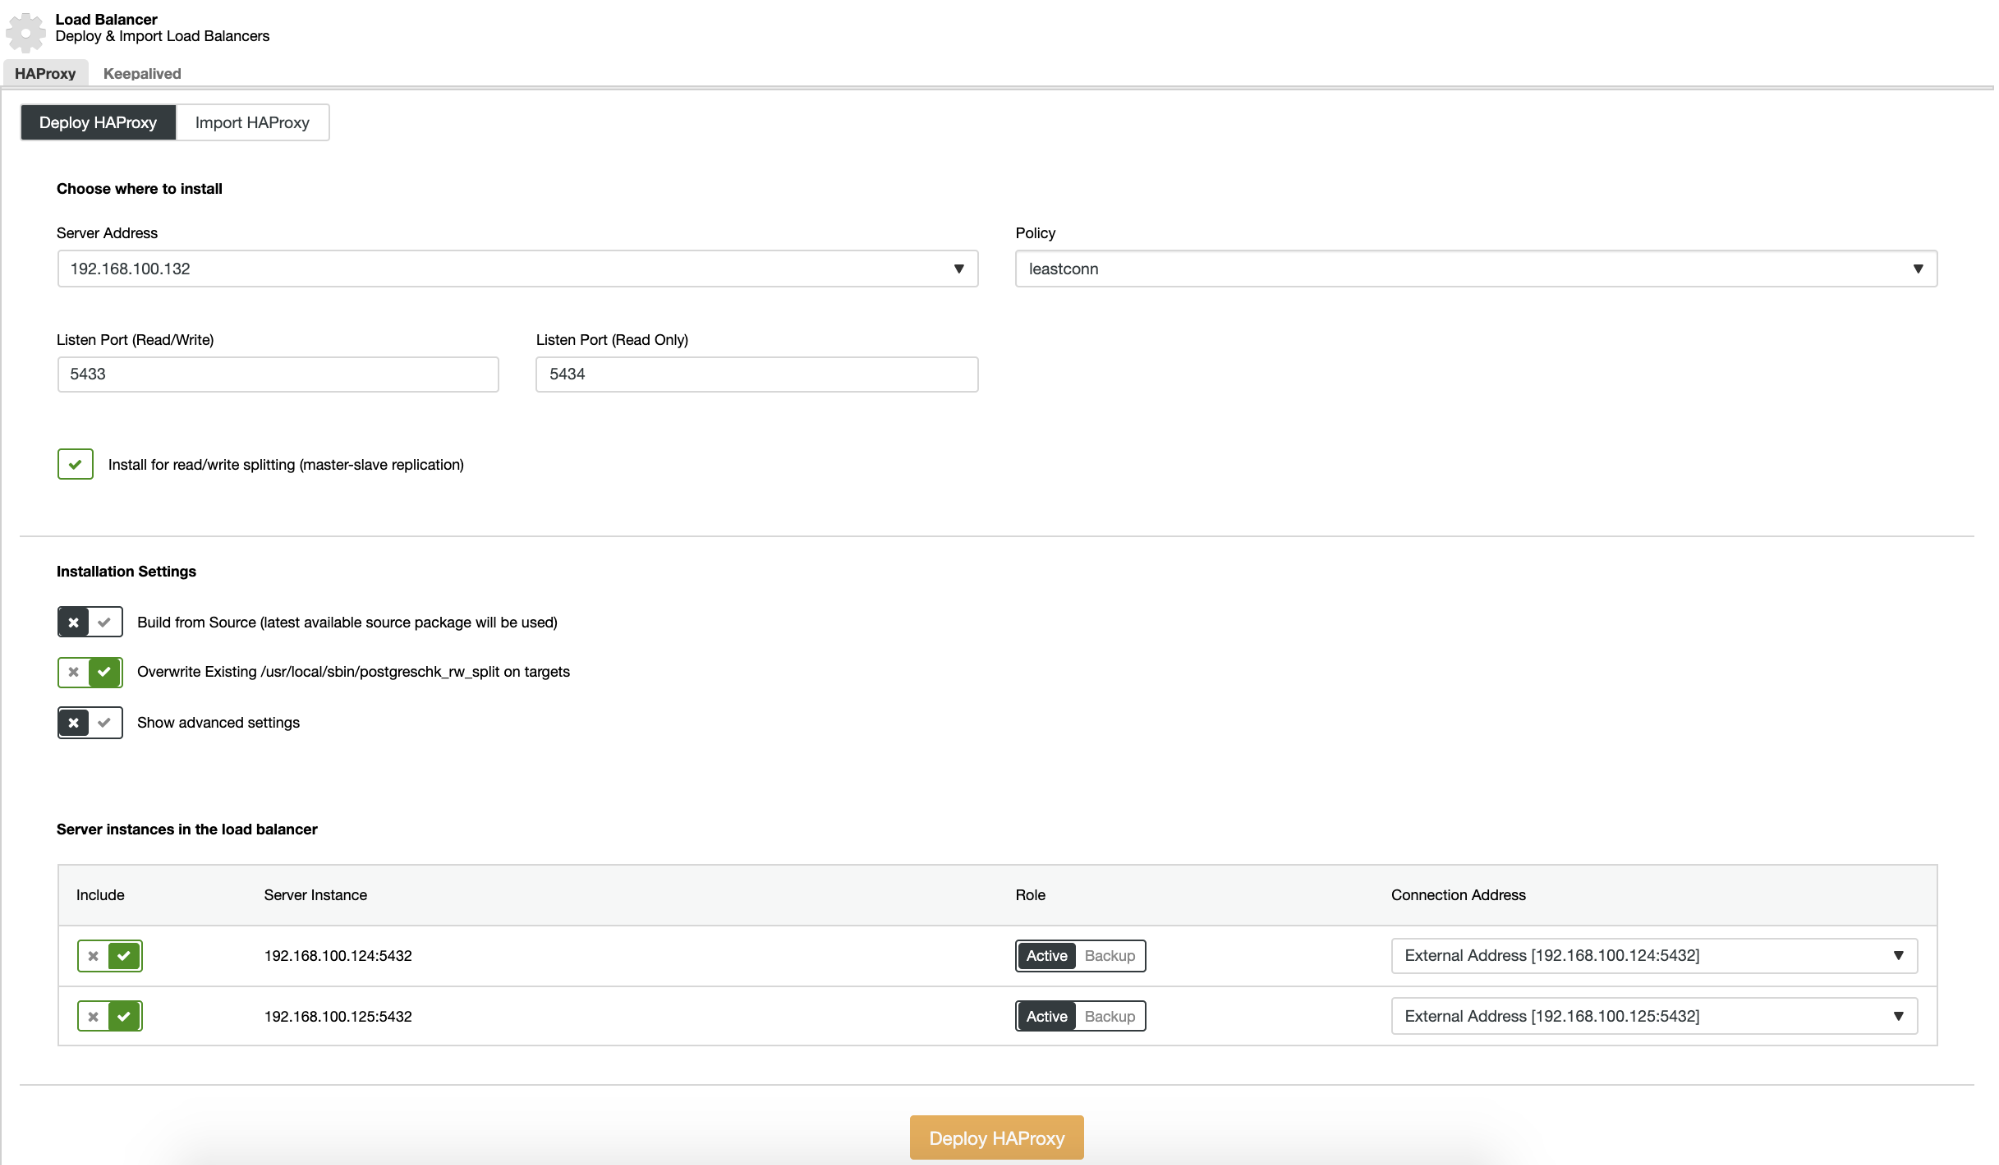
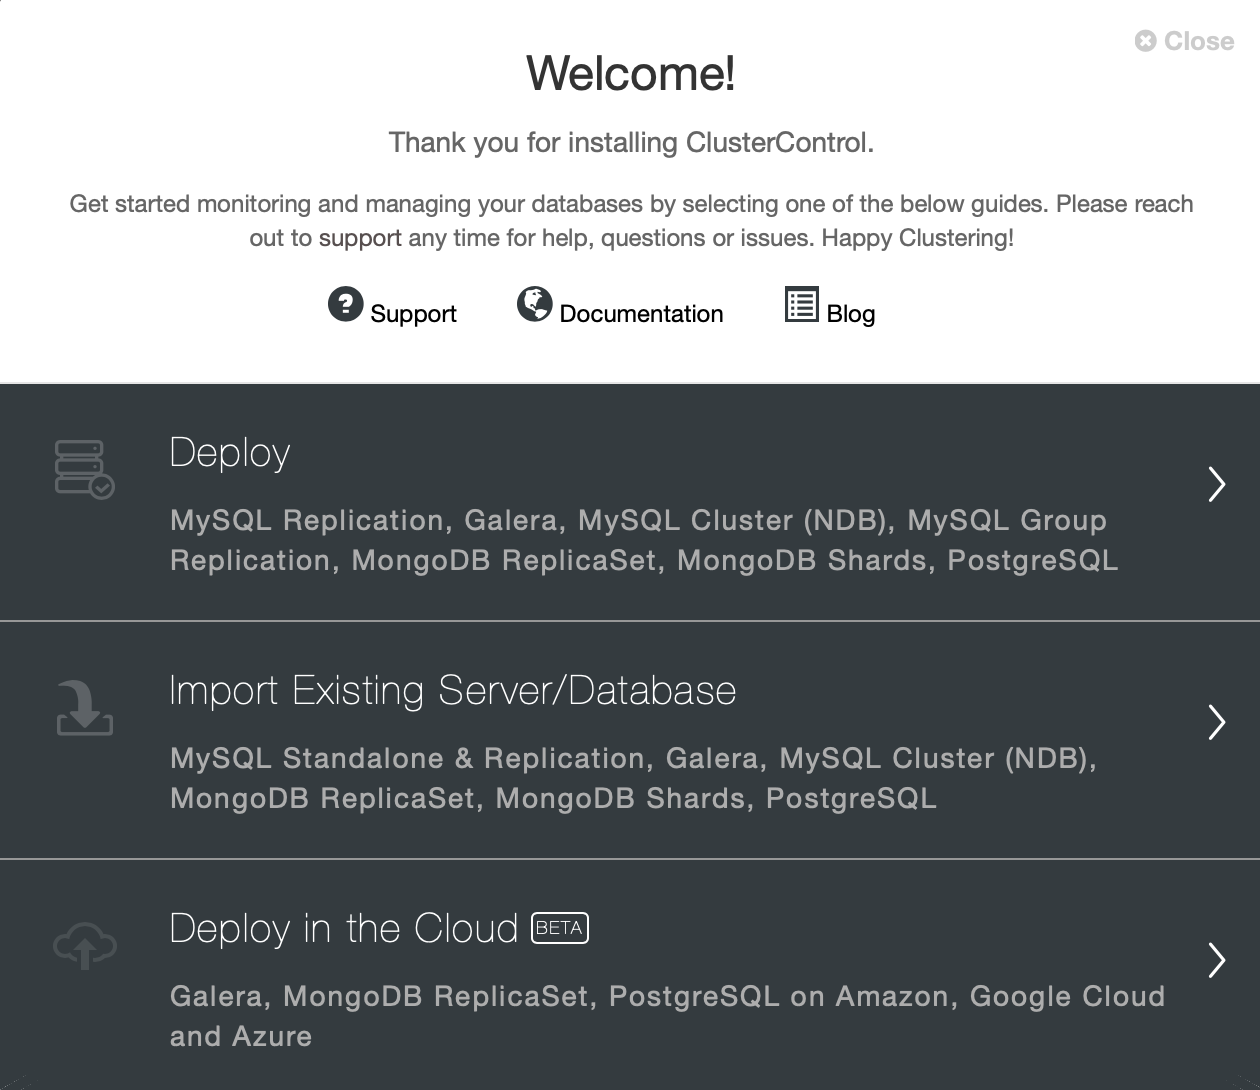
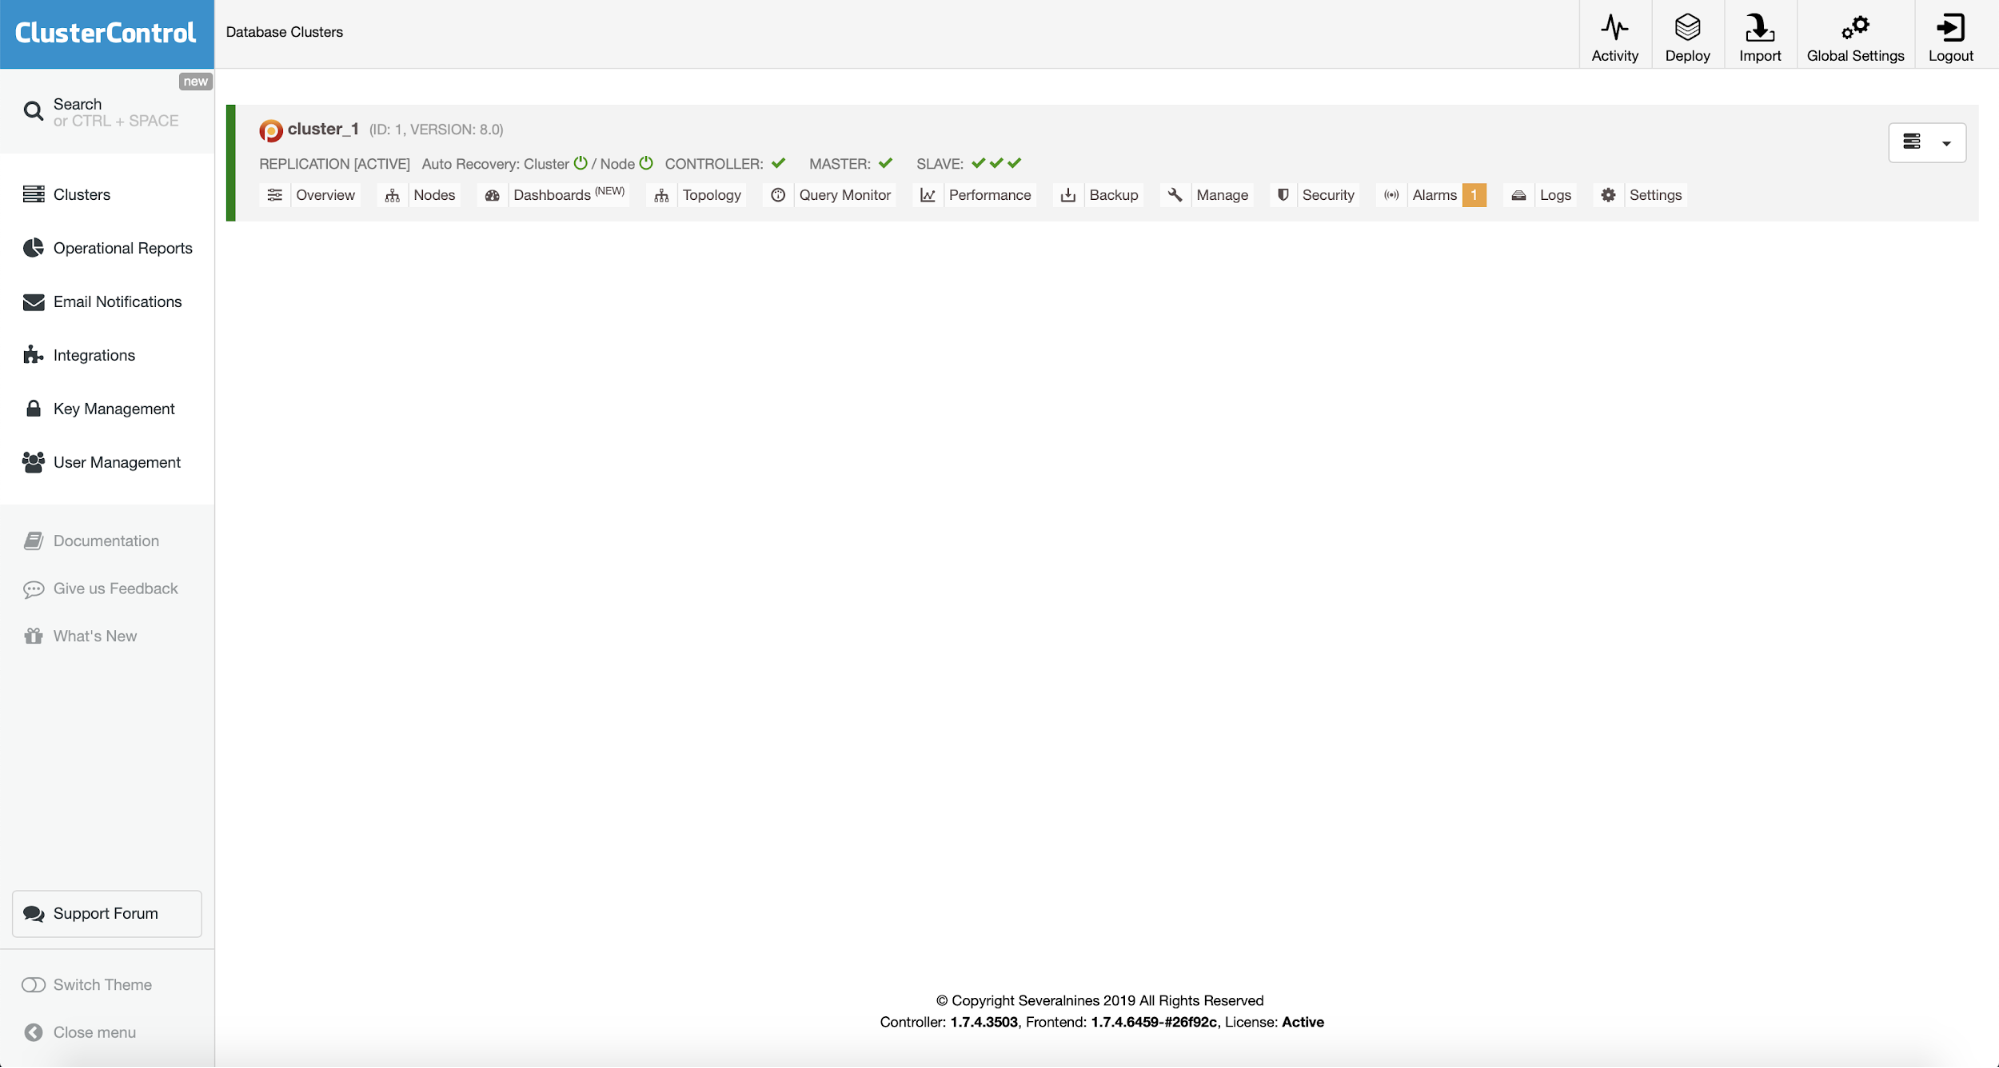
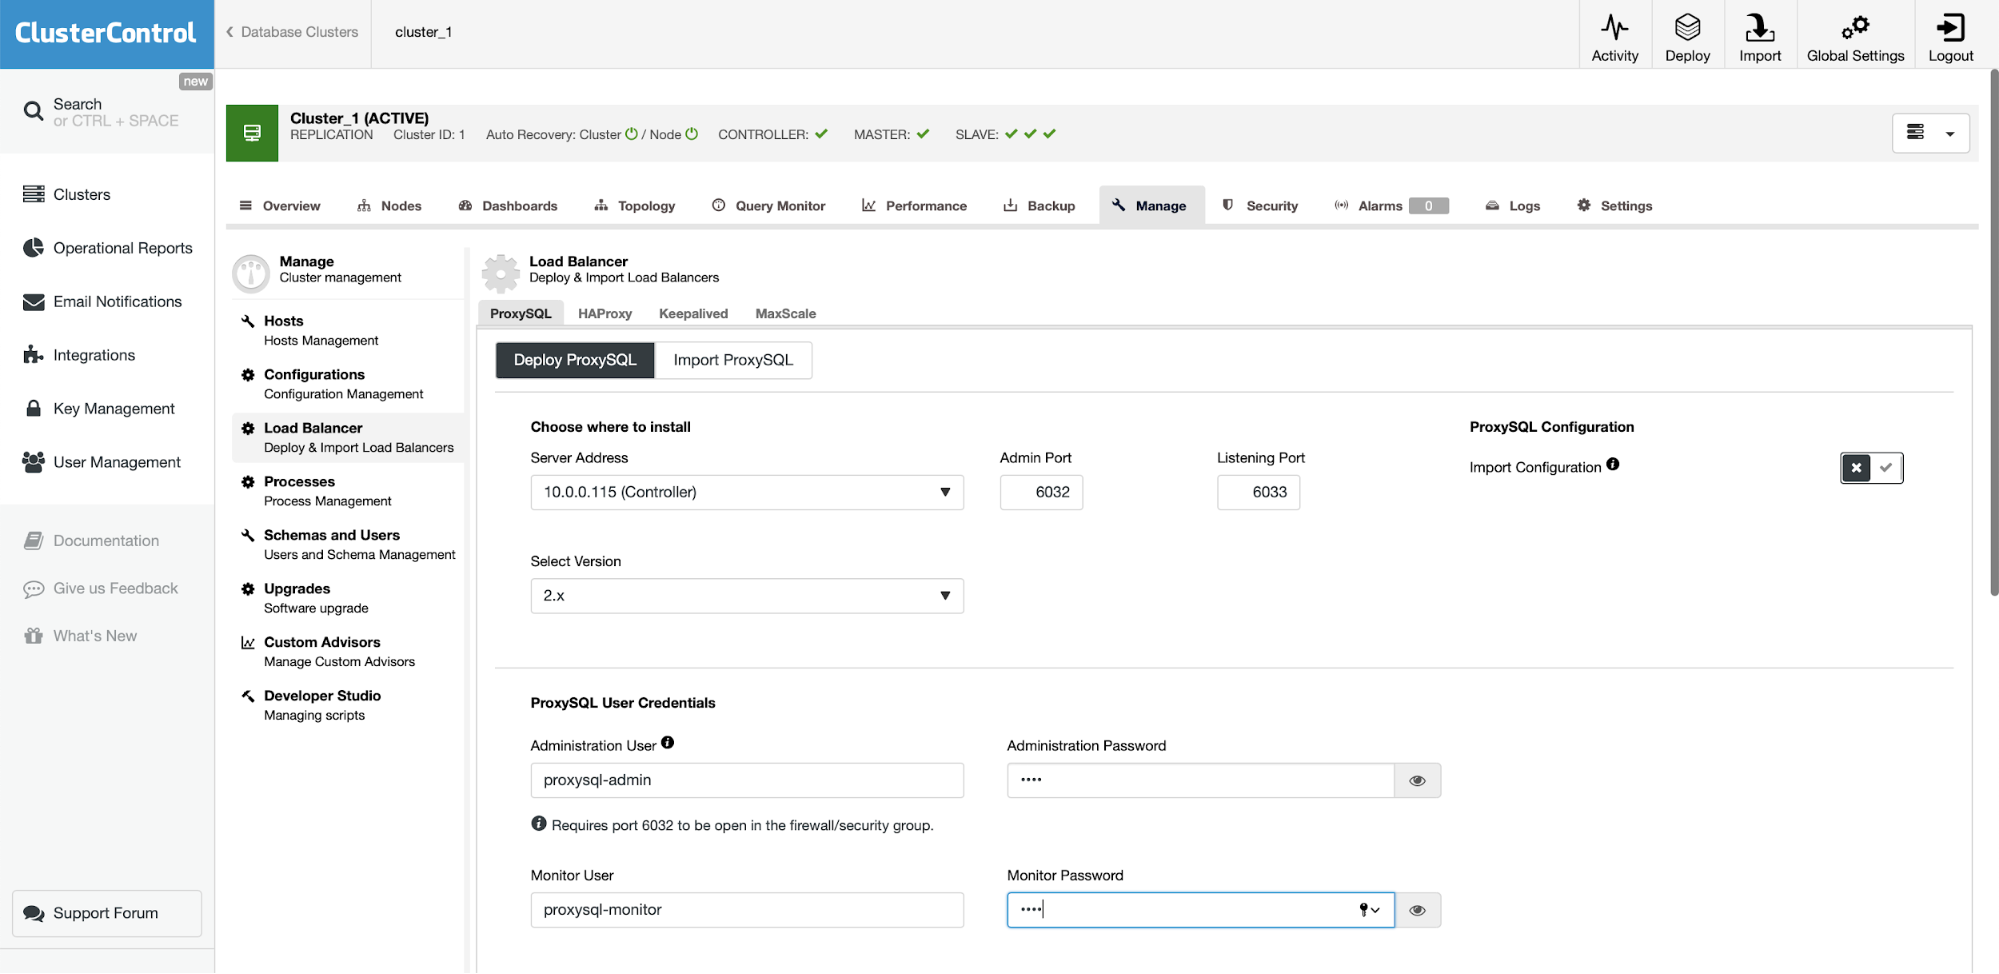
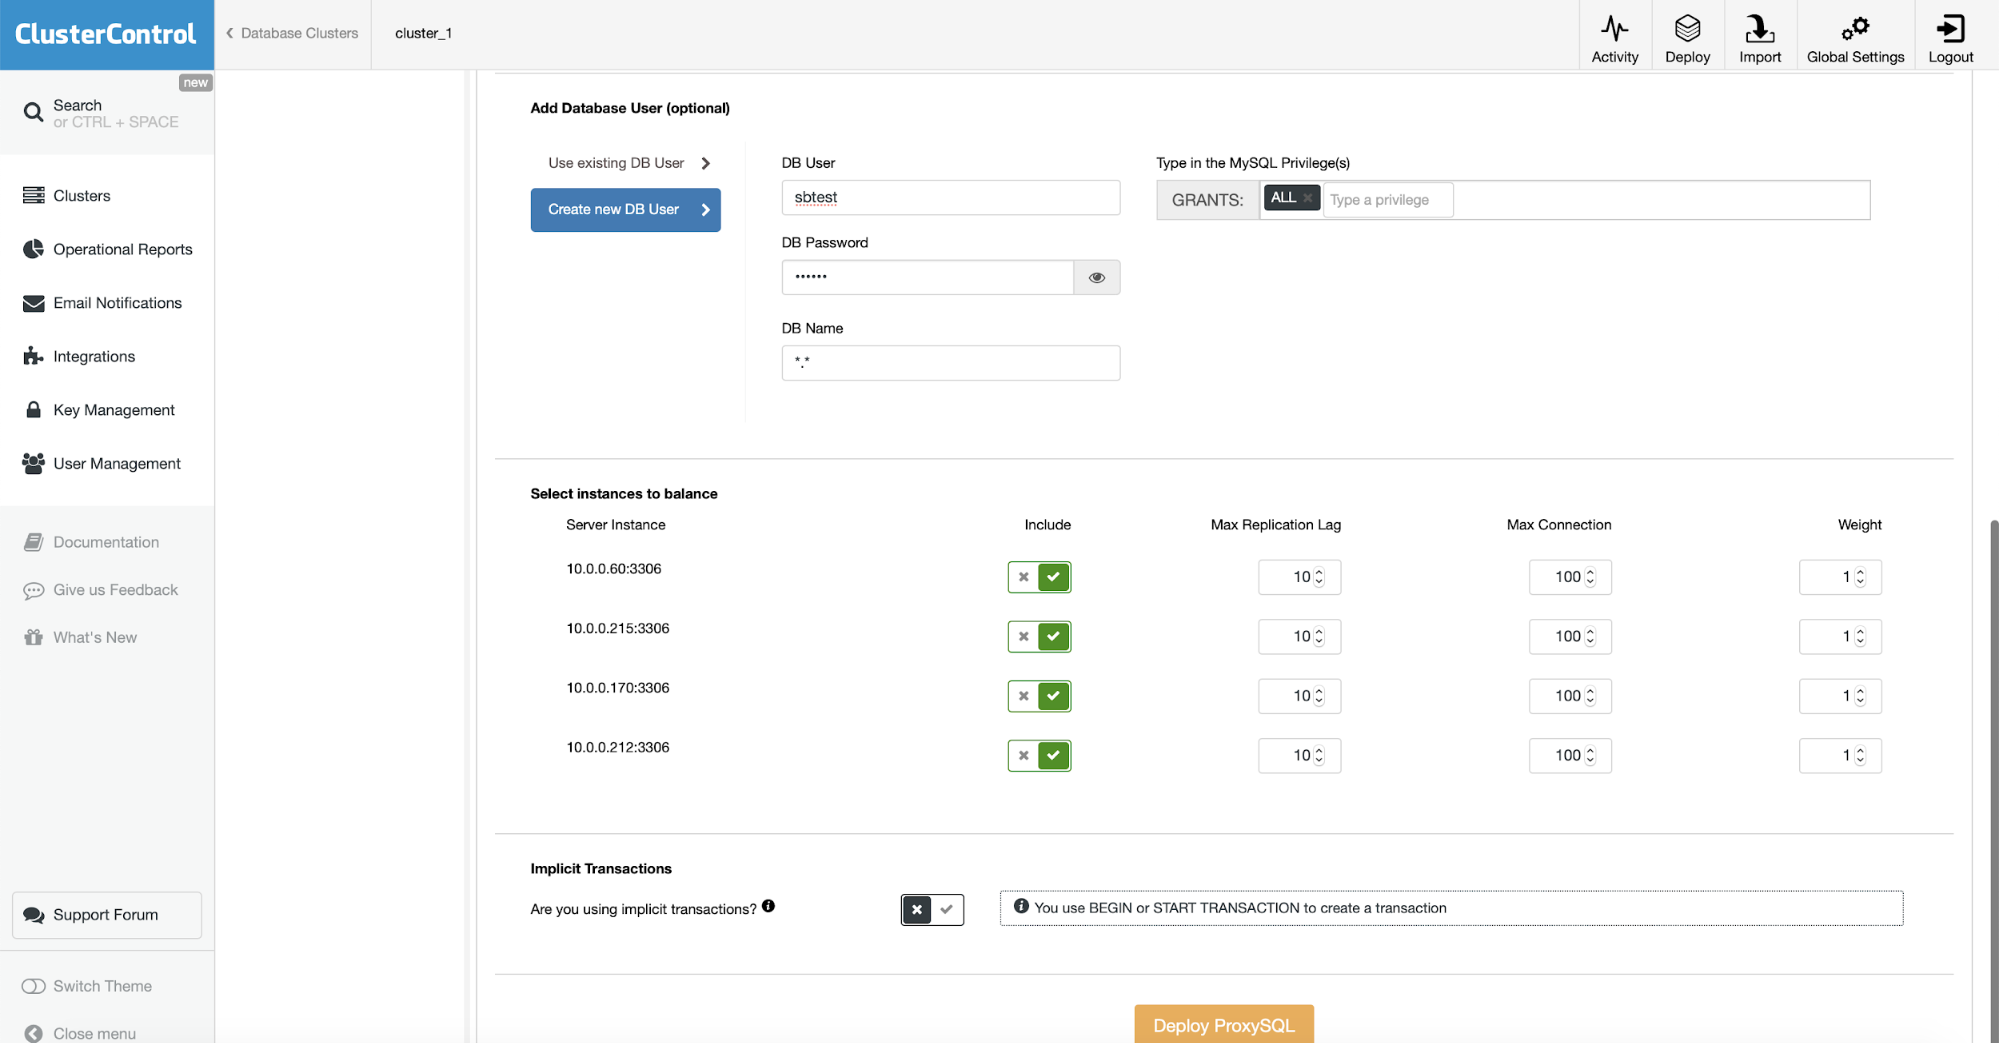
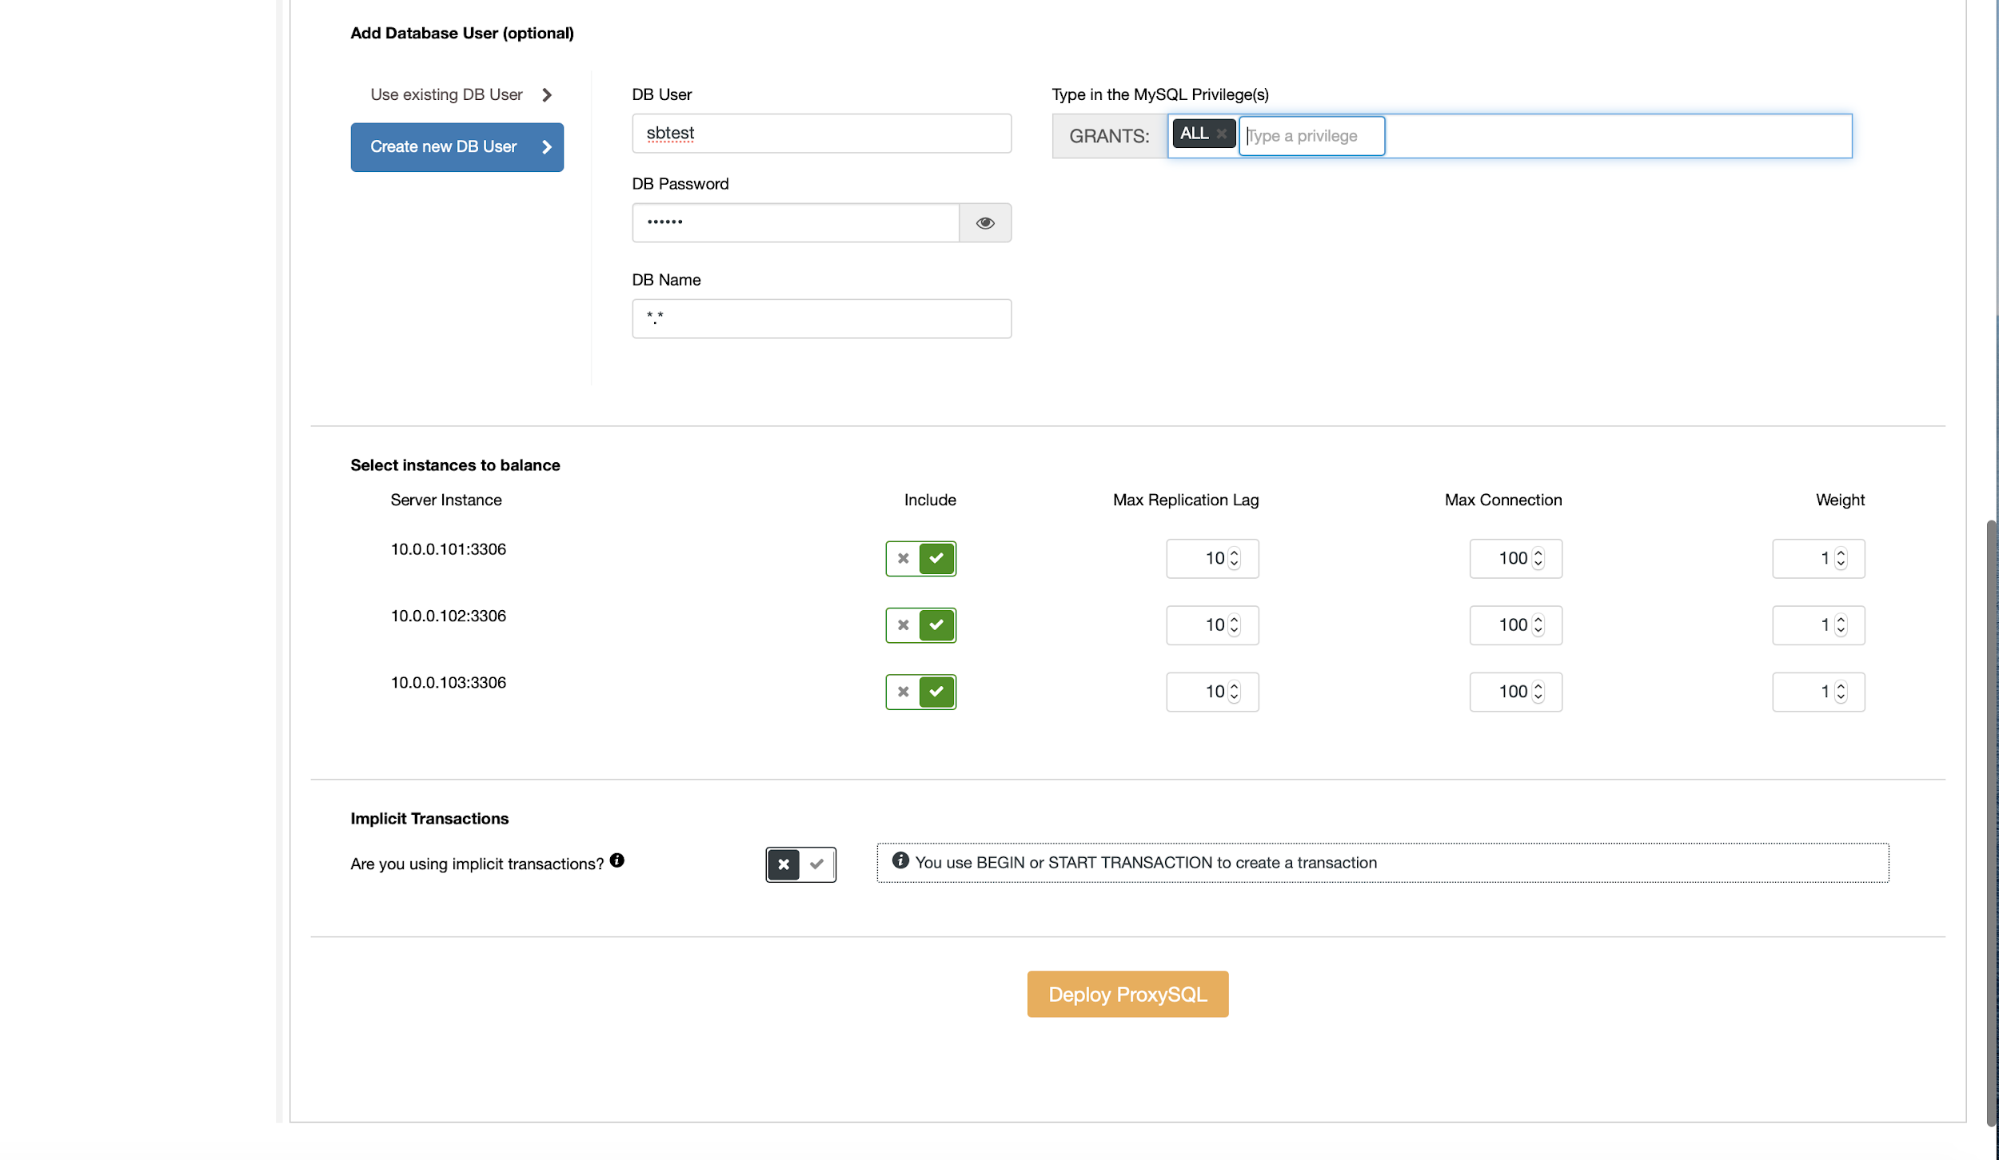
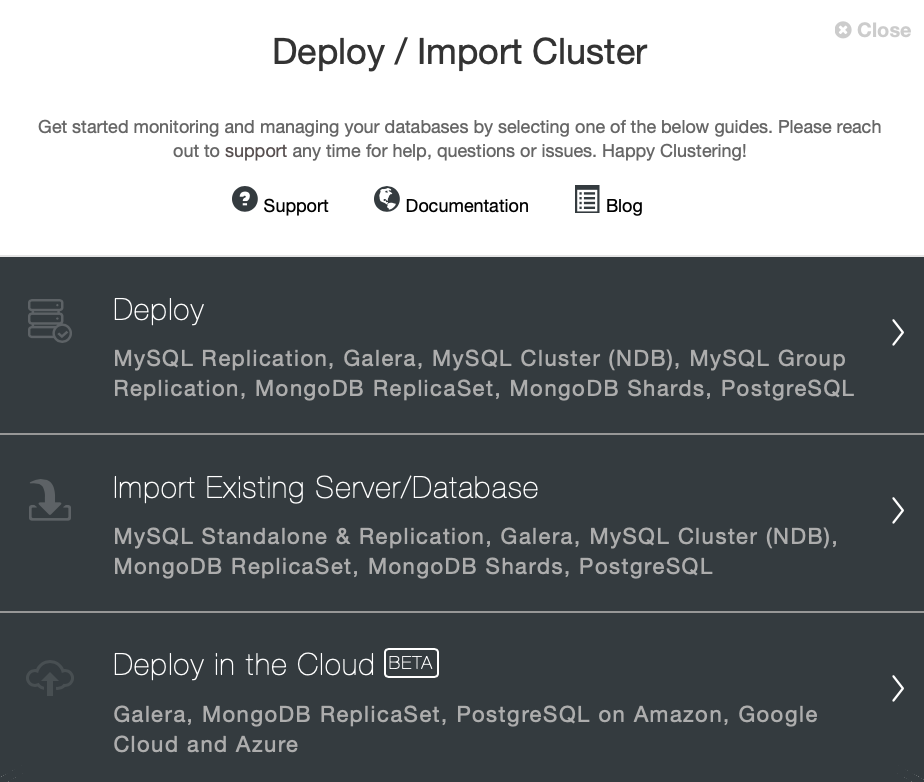
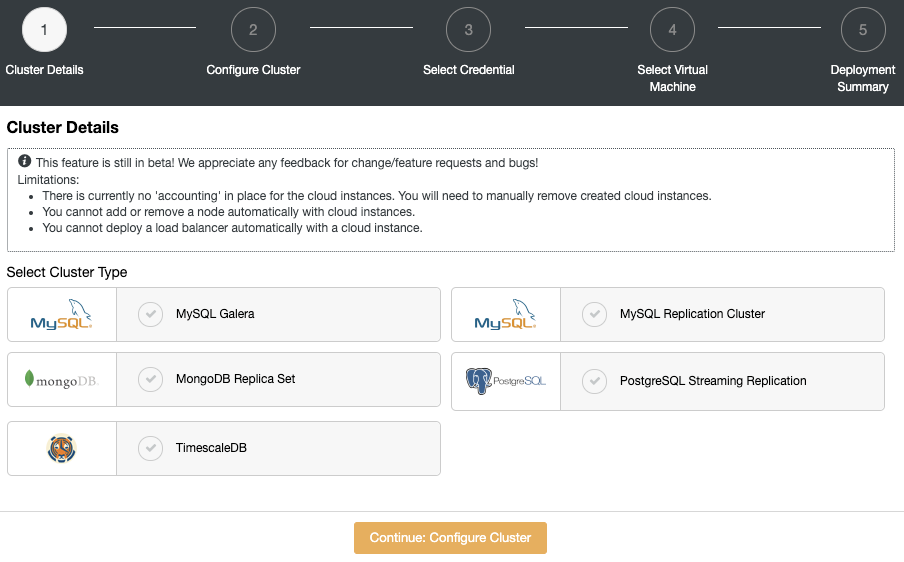
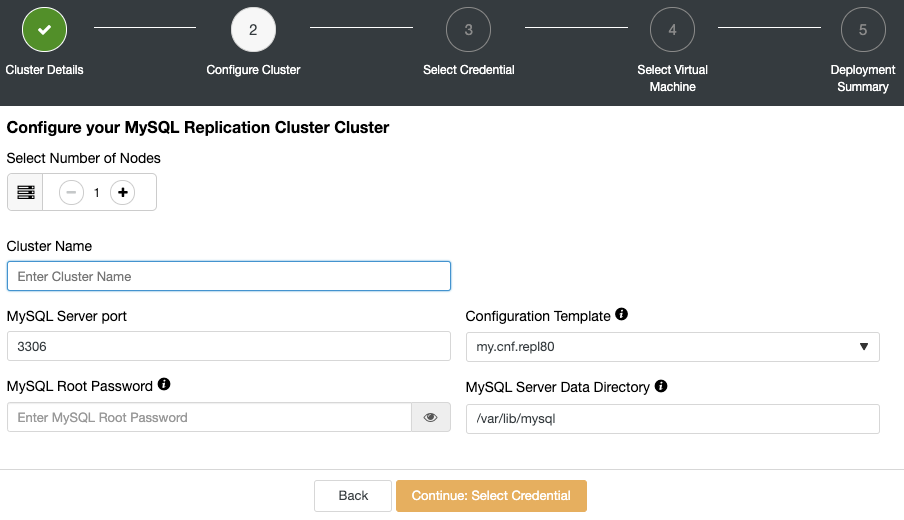
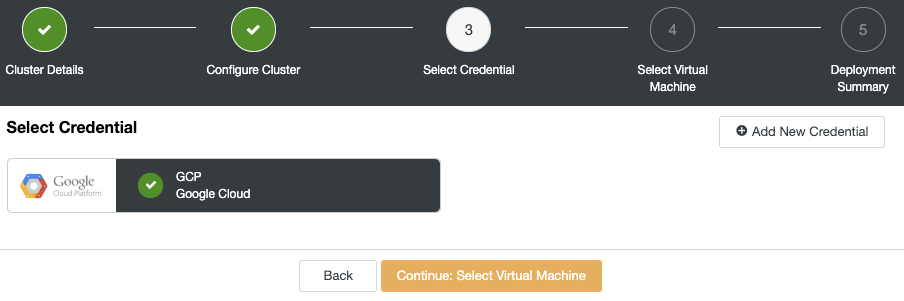
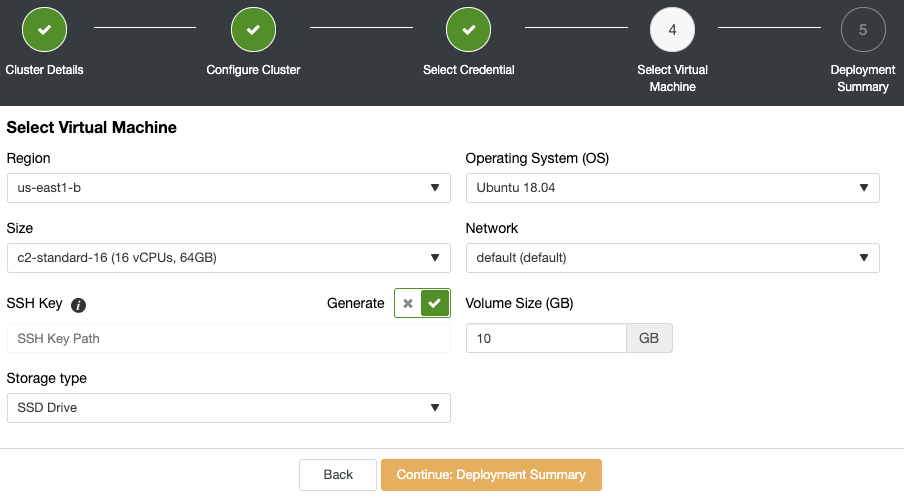
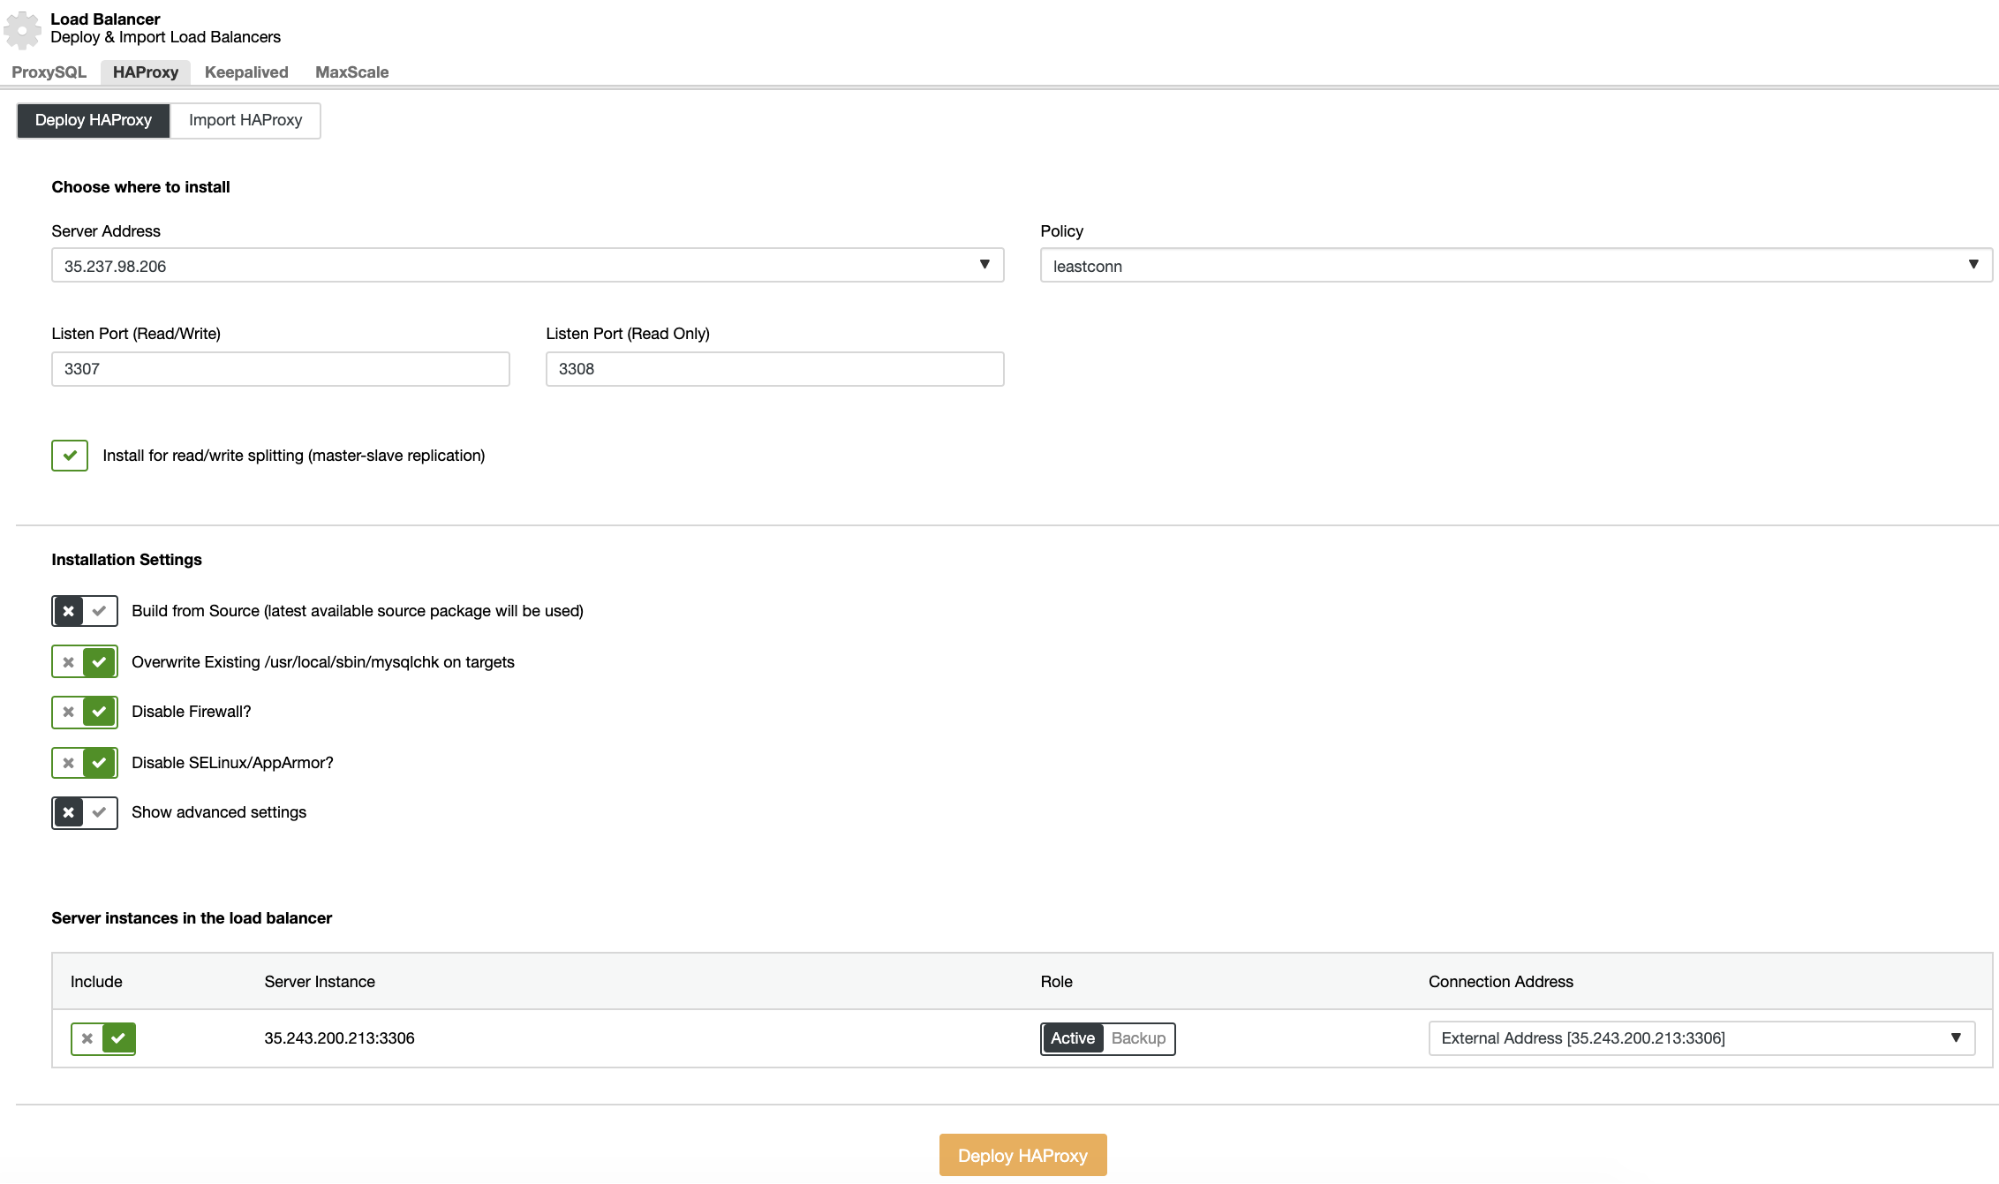
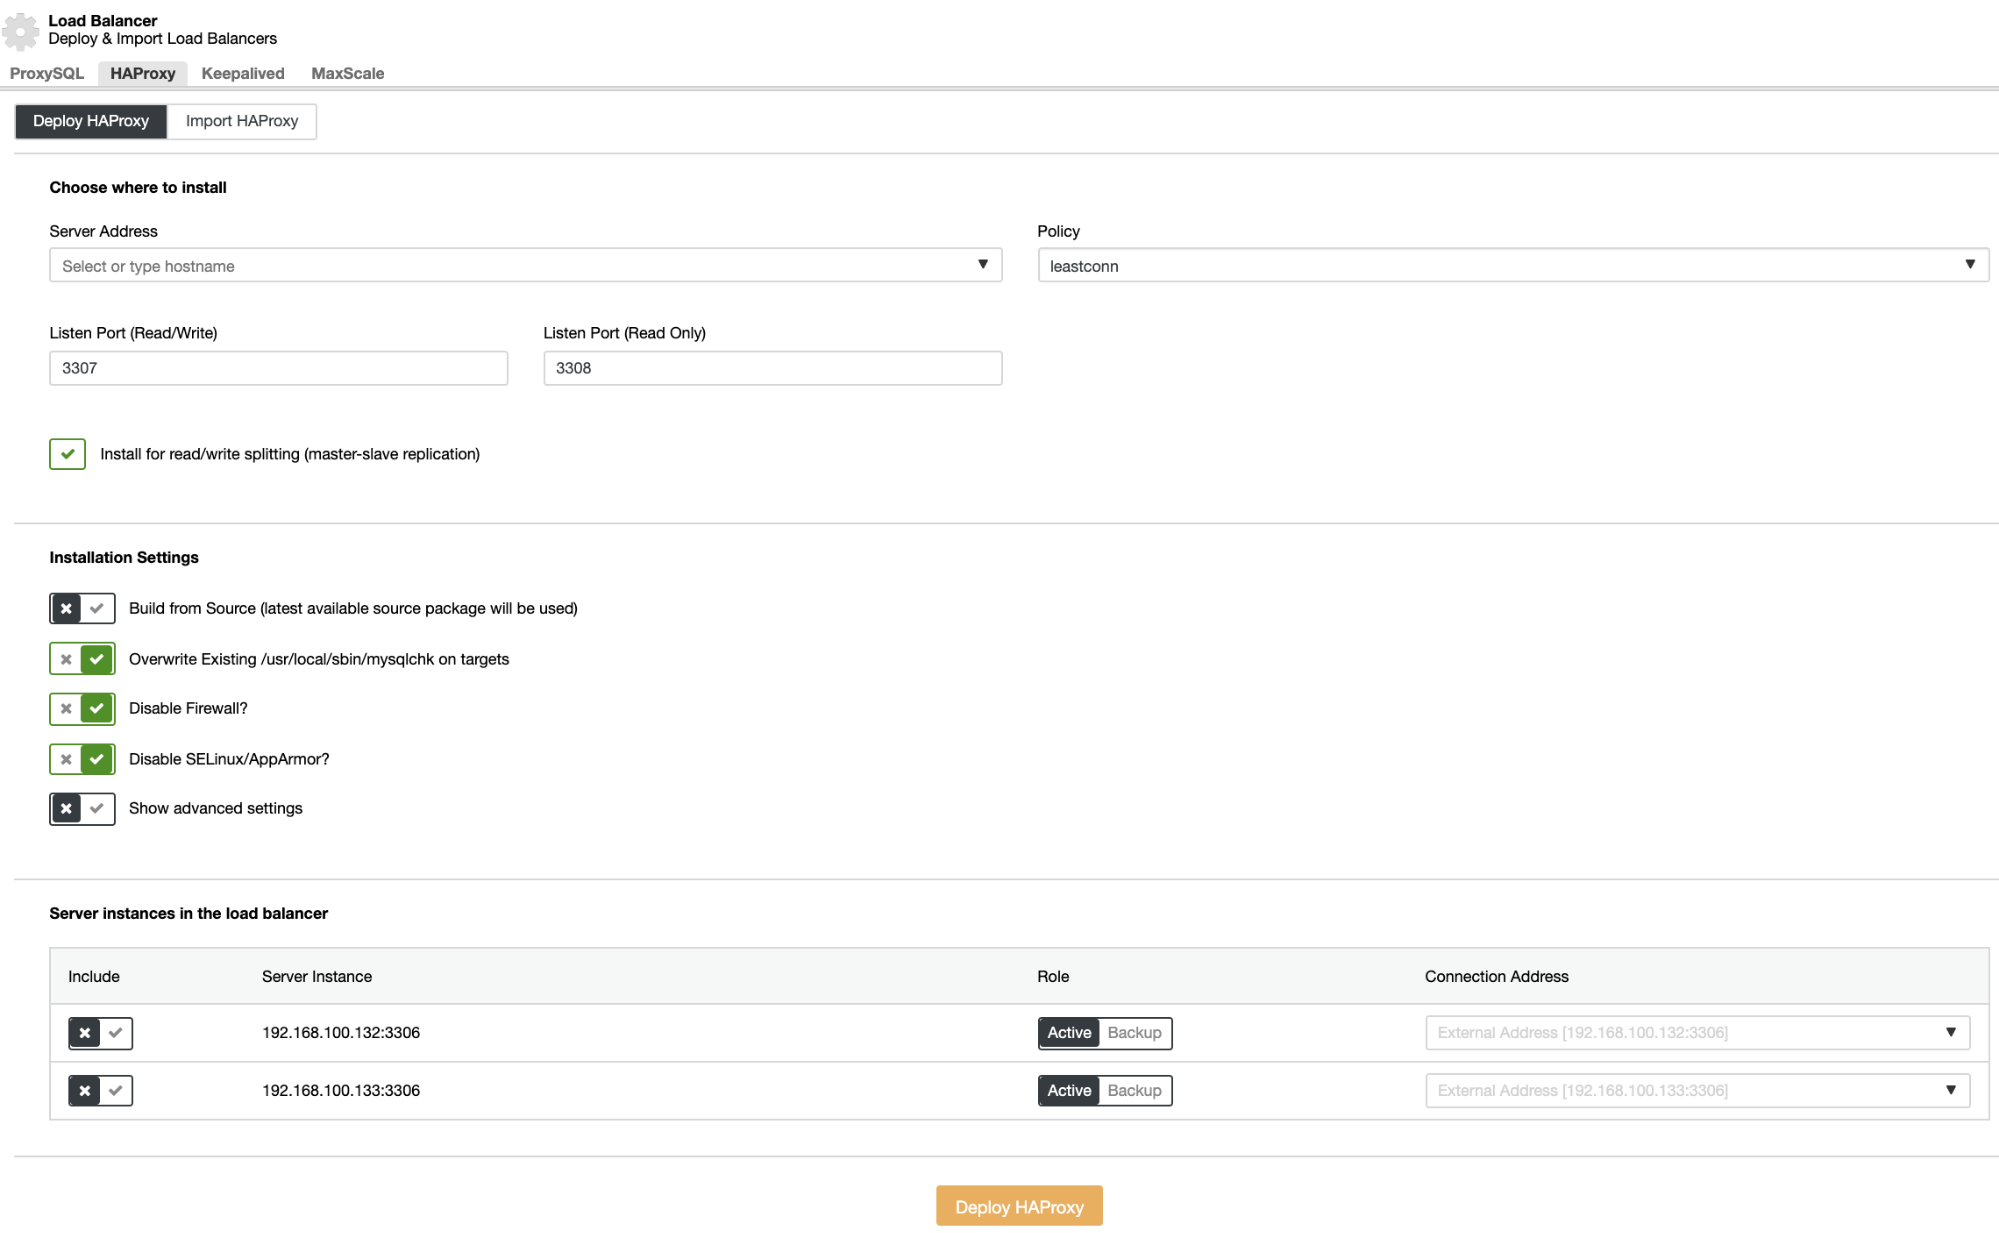
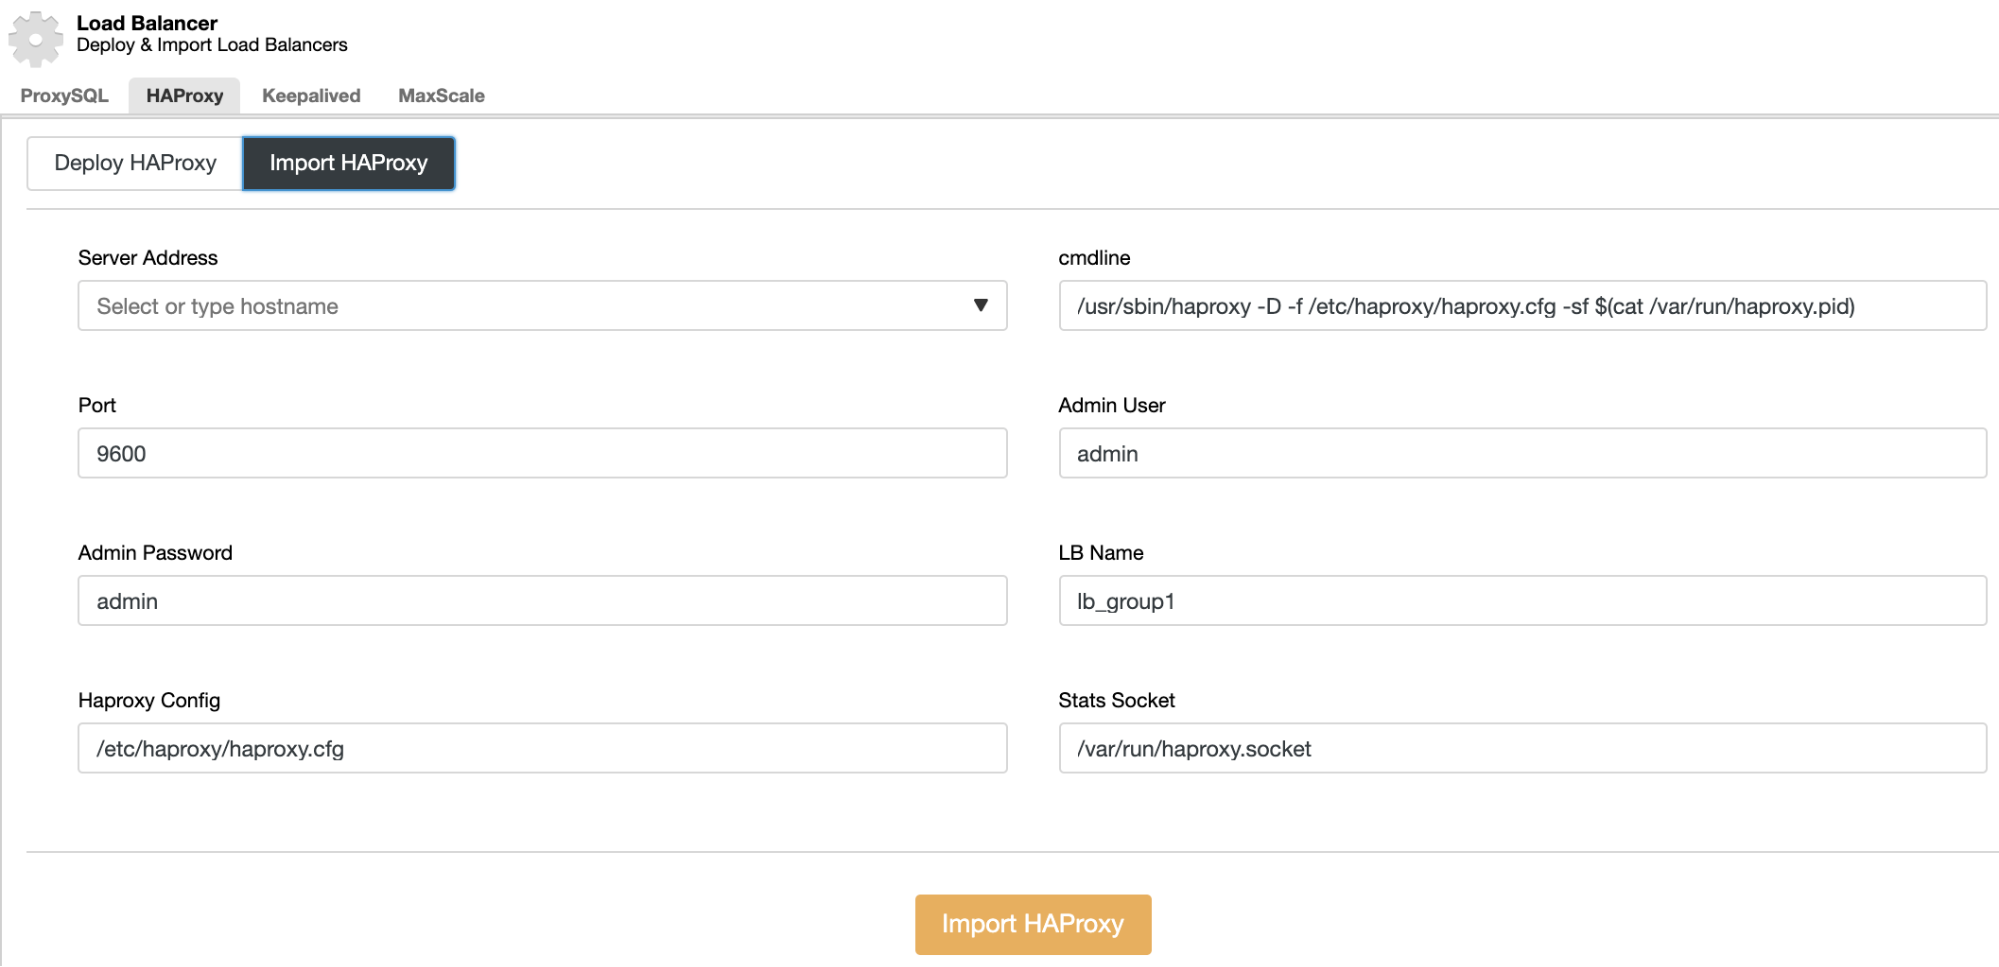
Deployment of ProxySQL in ClusterControl is just a matter of a handful of clicks.

Deploy ProxySQL in ClusterControl

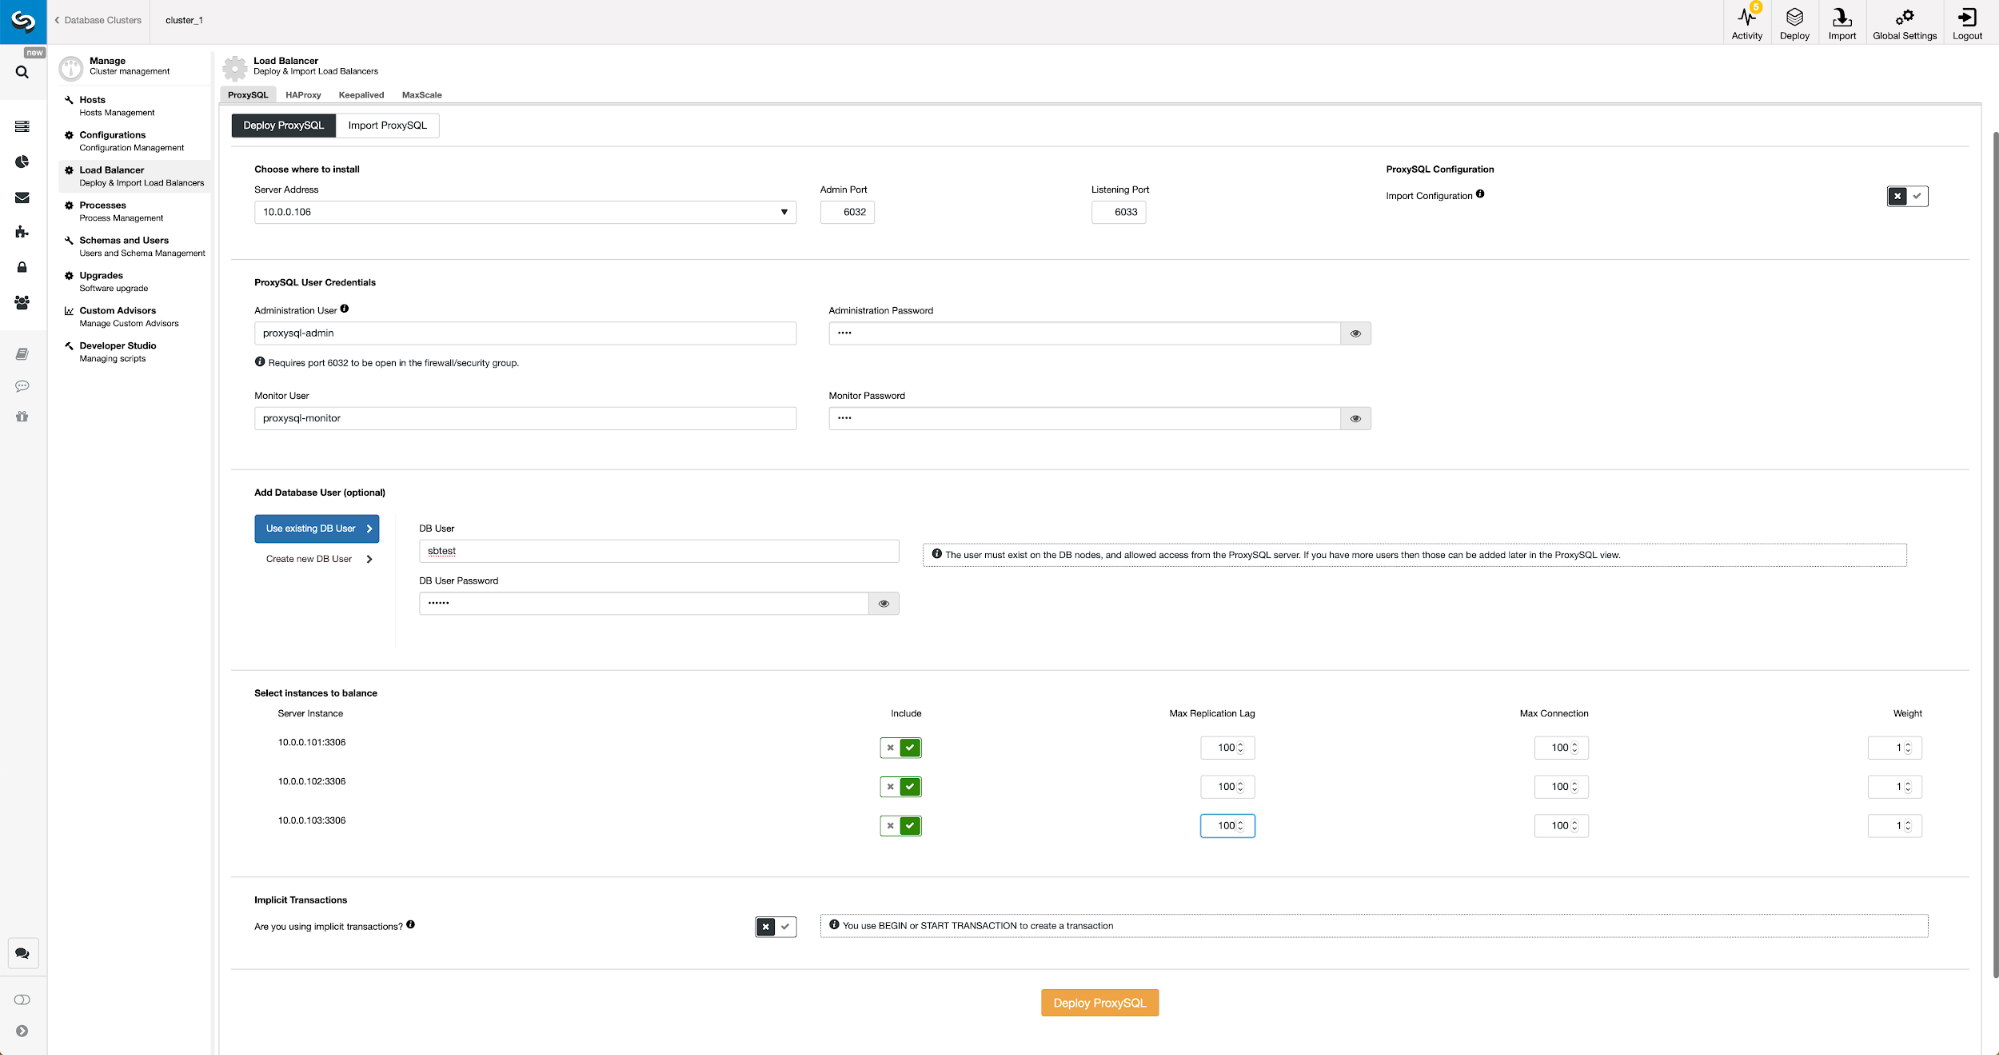
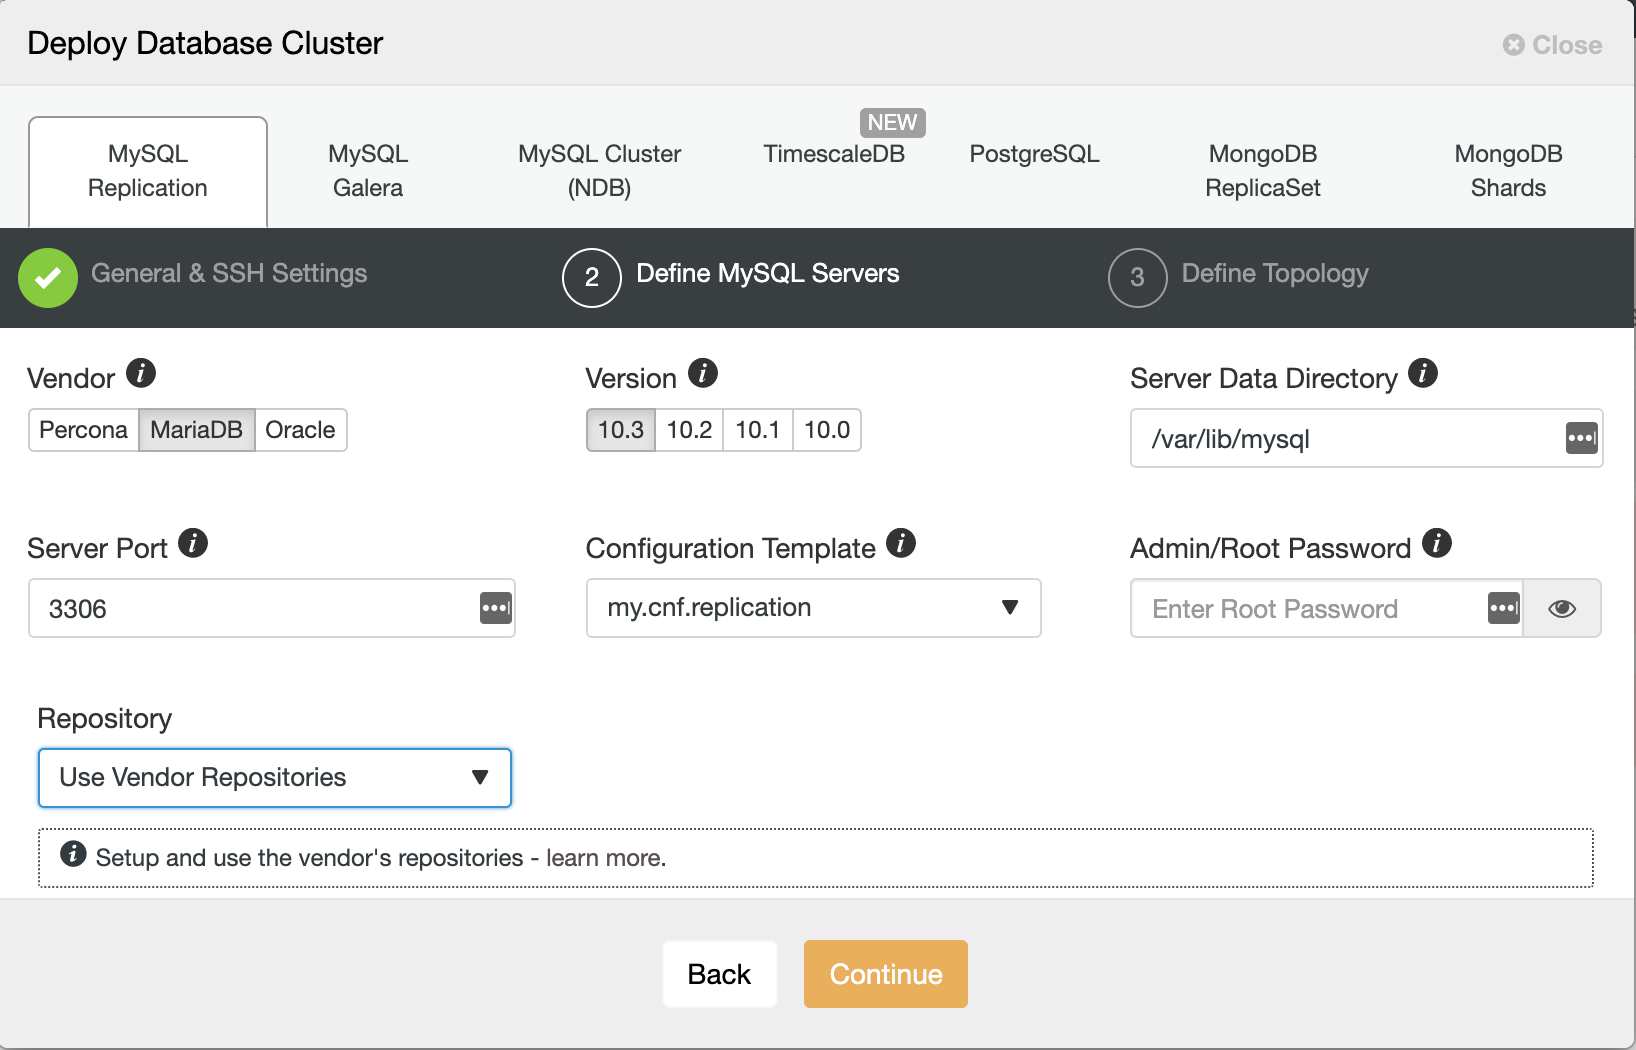
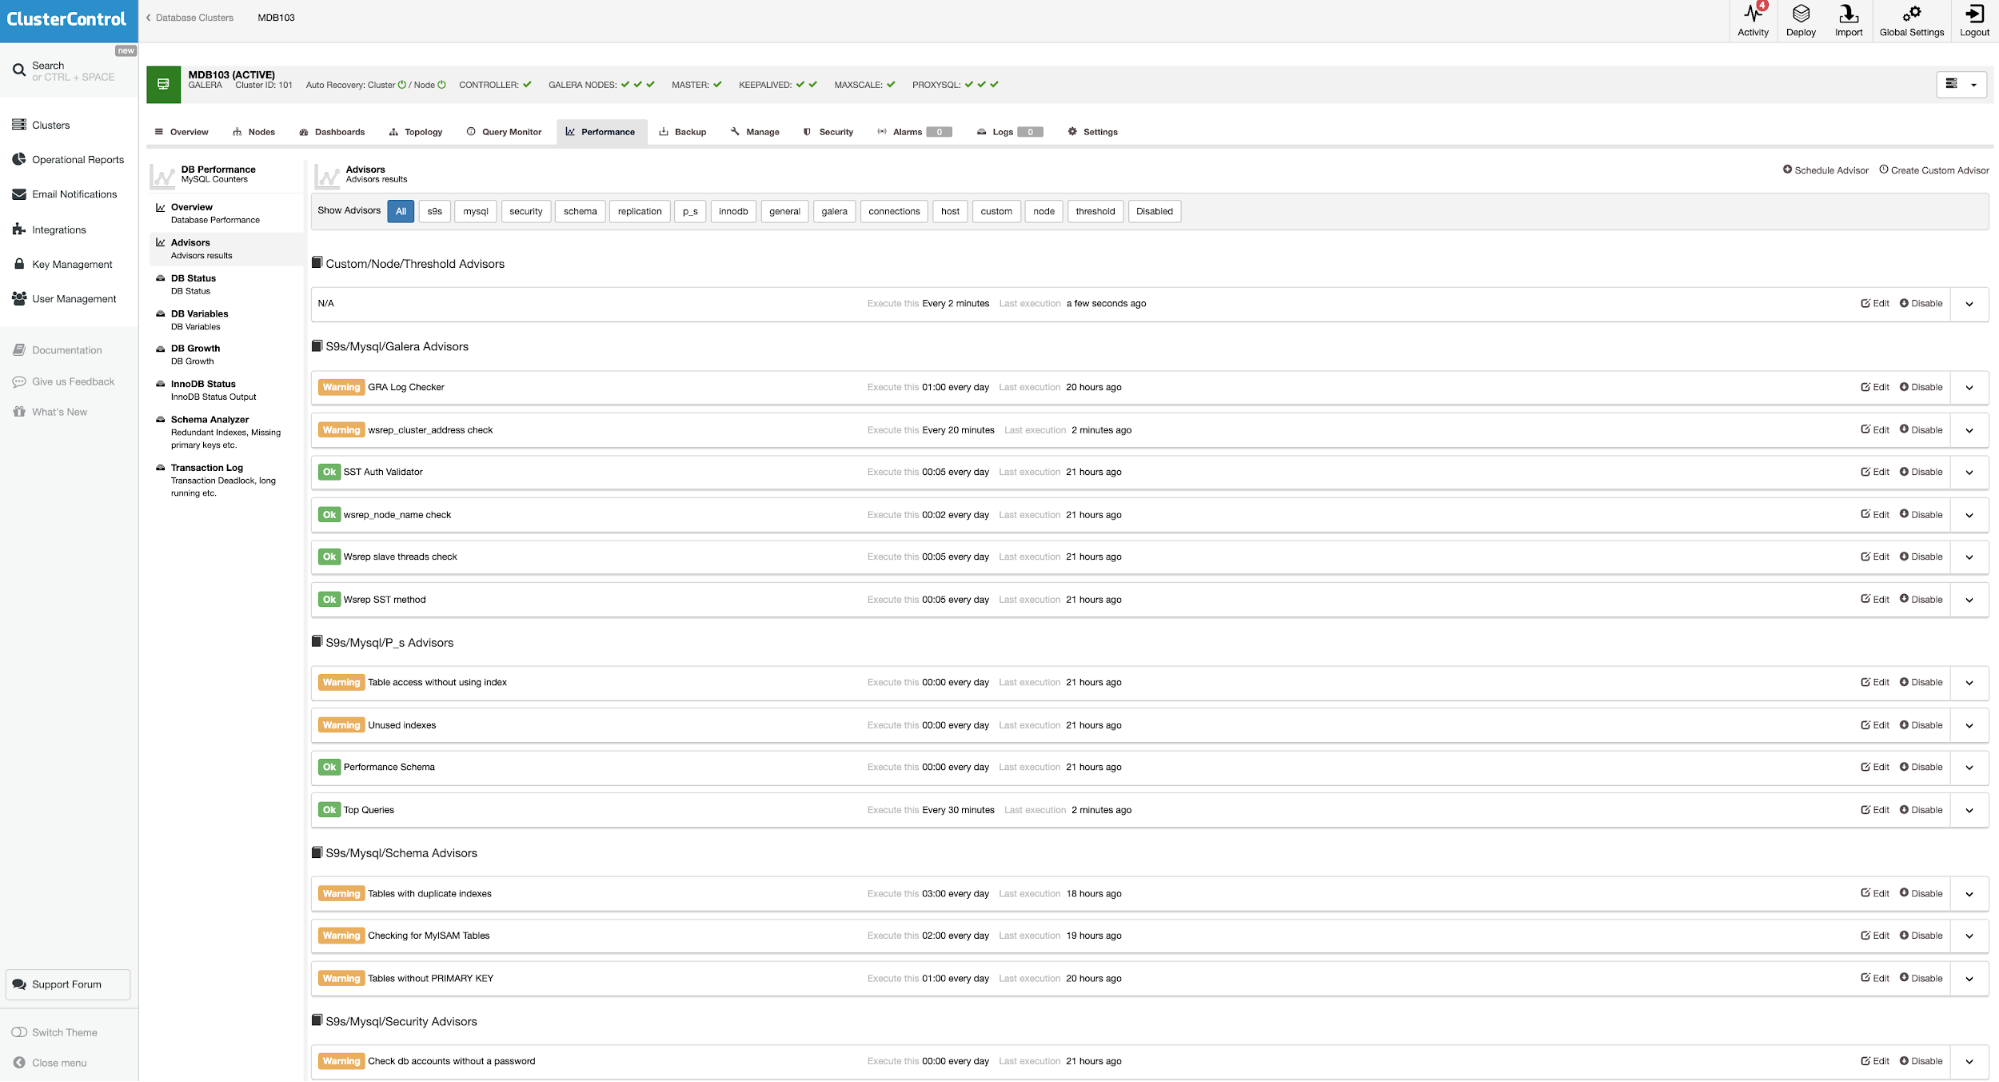
We had to pick a node’s IP or hostname, pass credentials for CLI administrative user and MySQL monitoring user. We decided to use existing MySQL and we passed access details for ‘sbtest’@’%’ user that we use in the application. We picked which nodes we want to use in the load balancer, we also increased max replication lag (if that threshold is crossed, ProxySQL will not send the traffic to that slave) from default 10 seconds to 100 as we are already suffering from the replication lag. After a short while ProxySQL nodes will be added to the cluster.

Deploying Keepalived for ProxySQL Using ClusterControl

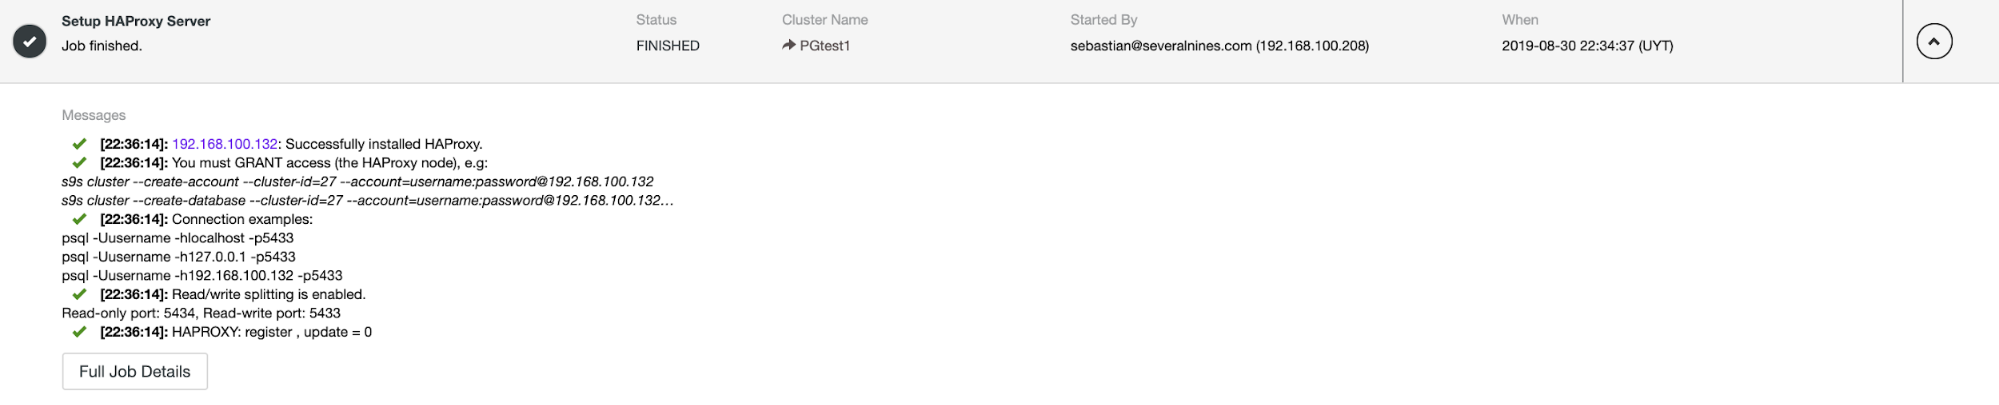
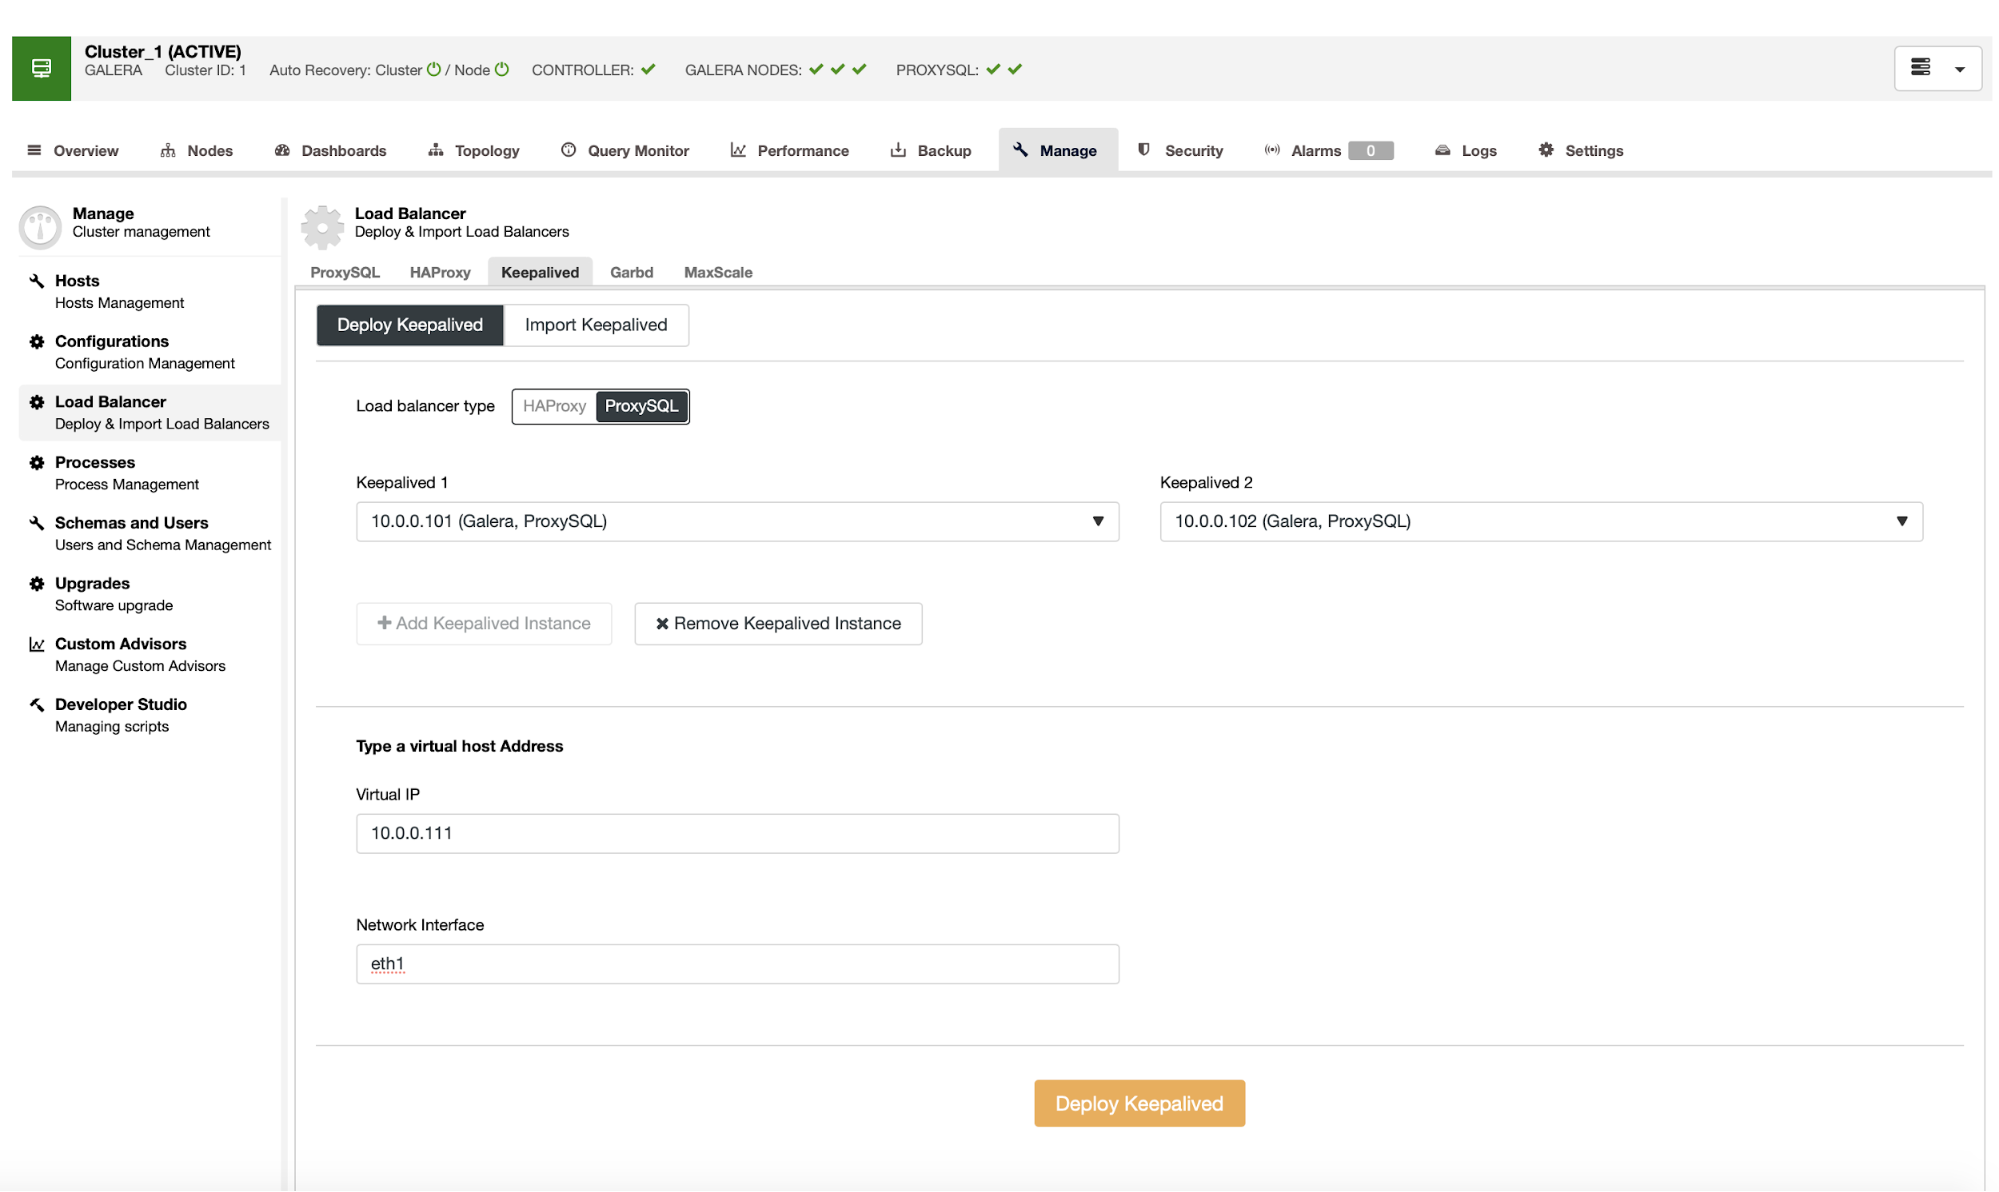
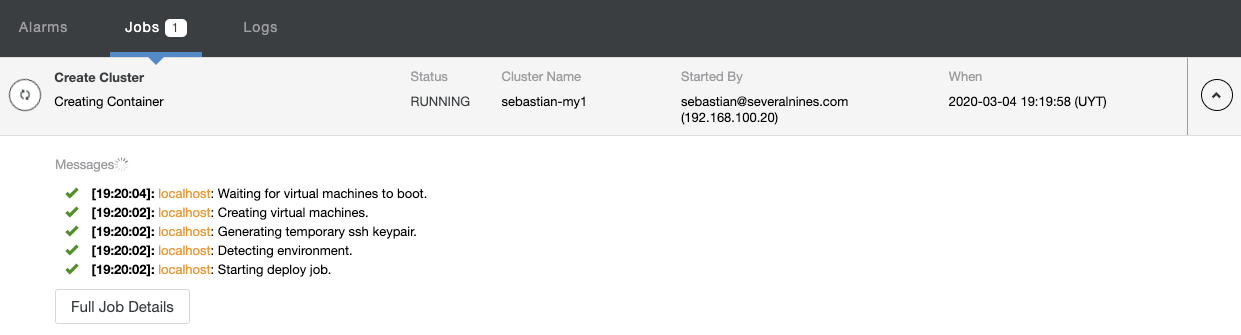
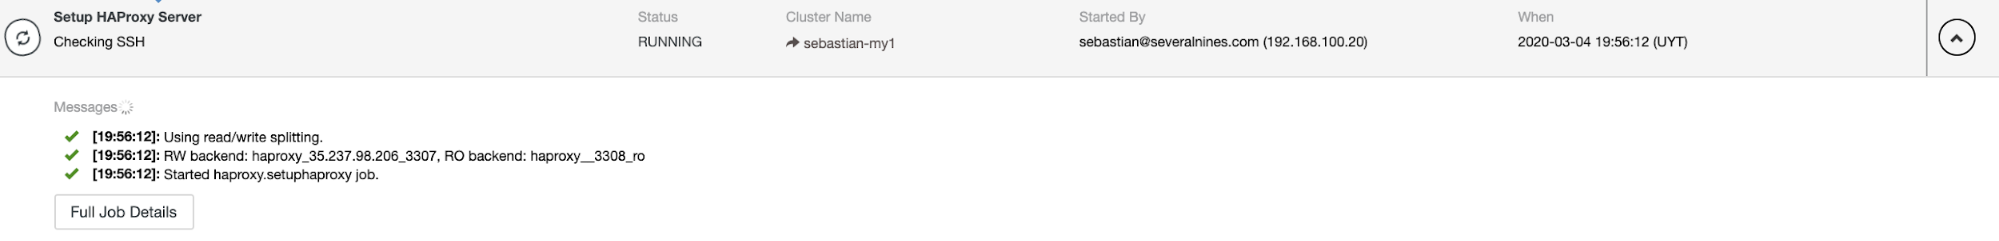
When ProxySQL nodes have been added it’s time to deploy Keepalived.

Keepalived with ProxySQL in ClusterControl

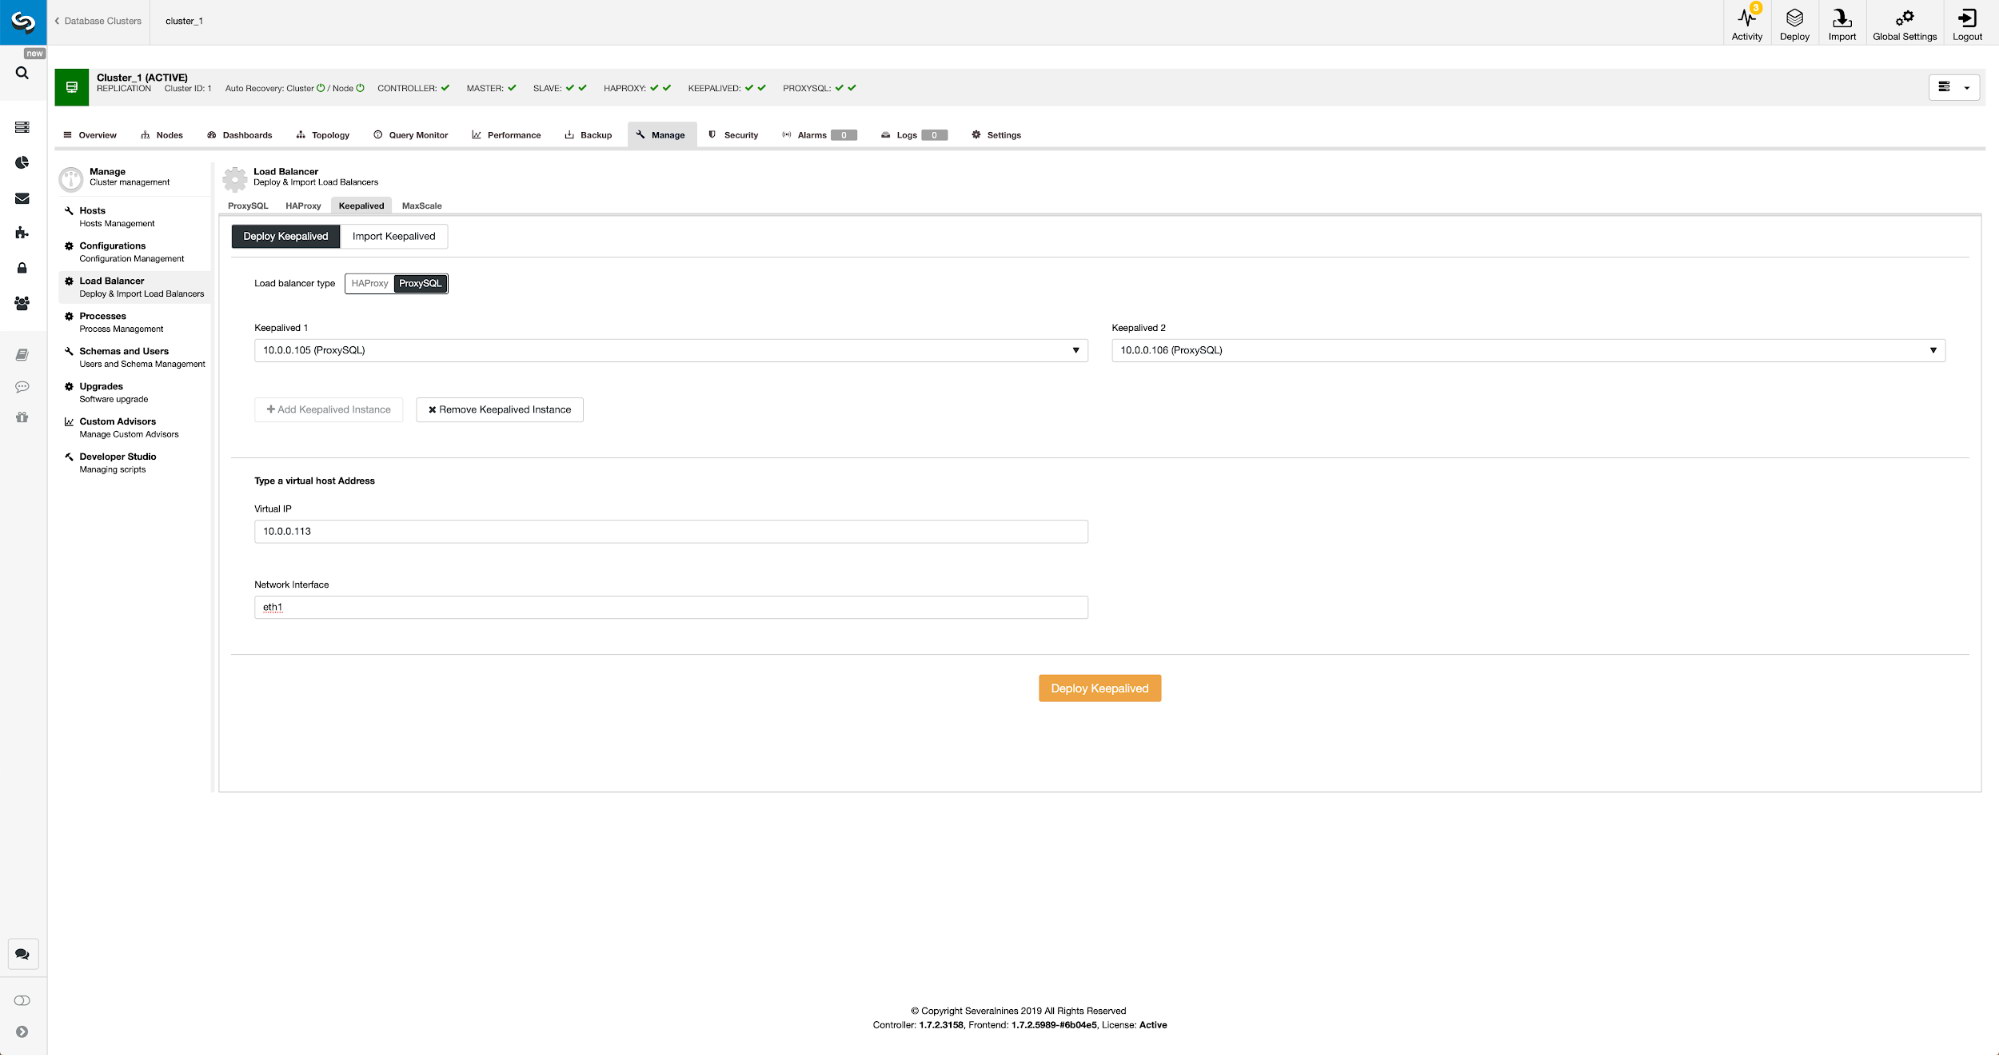
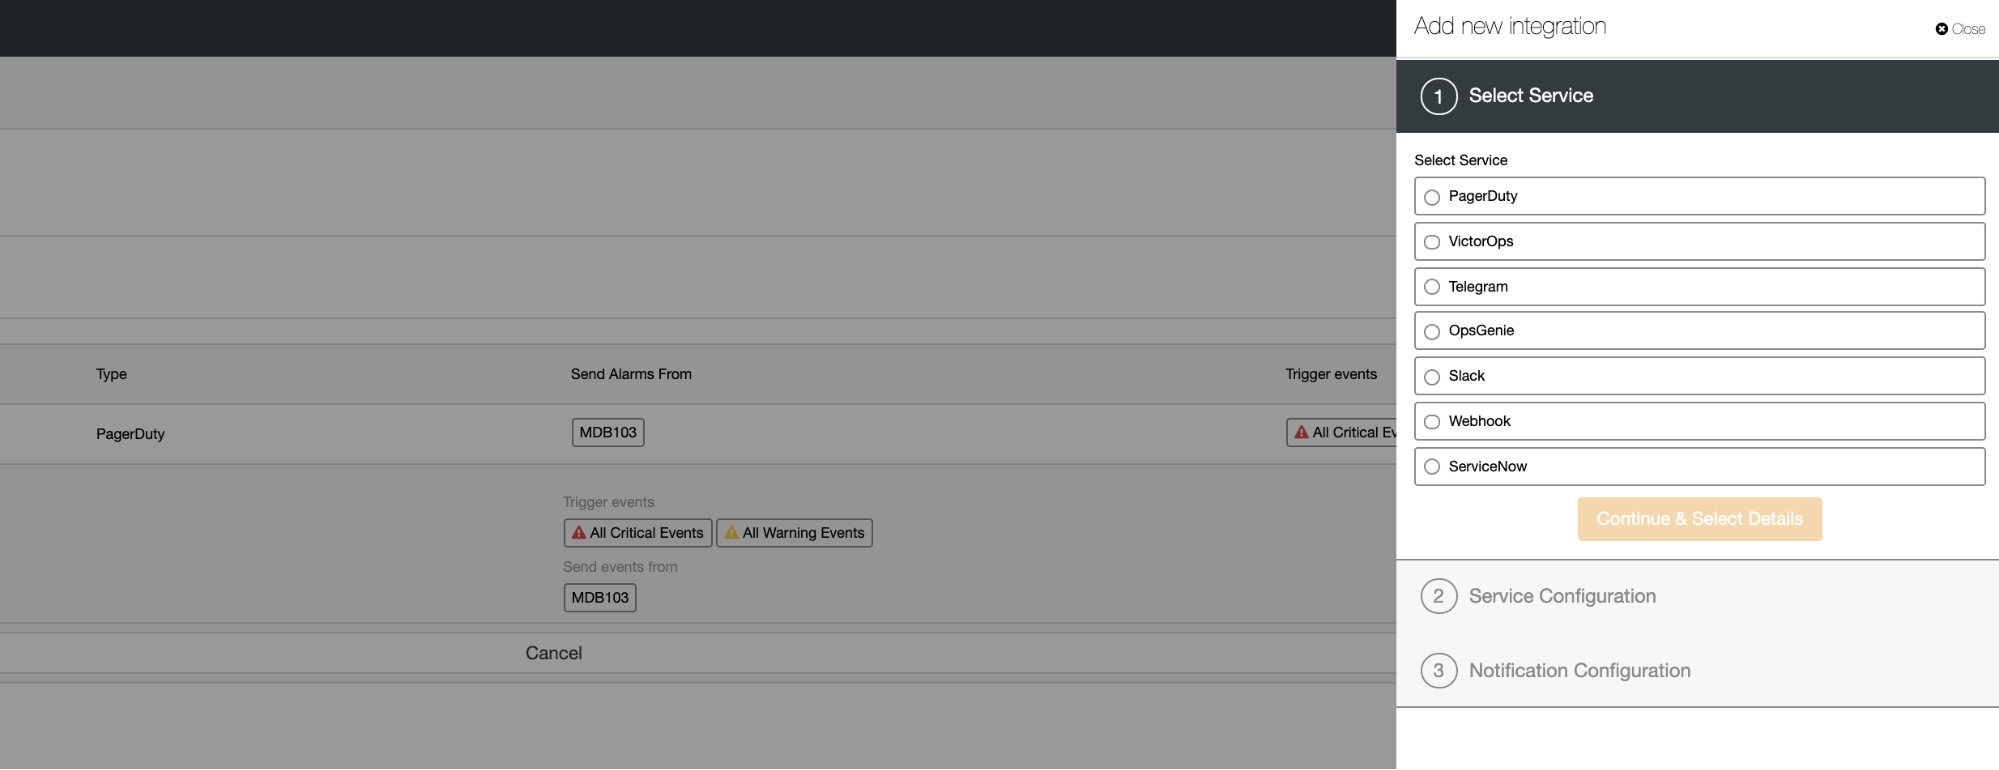
All we had to do is to pick which ProxySQL nodes we want Keepalived to deploy on, virtual IP and interface to which VIP will be bound. When deployment will be completed, we will switch the traffic to the new setup using one of the methods mentioned in the “Switching traffic to ProxySQL setup” section above.

Monitoring ProxySQL Traffic in ClusterControl

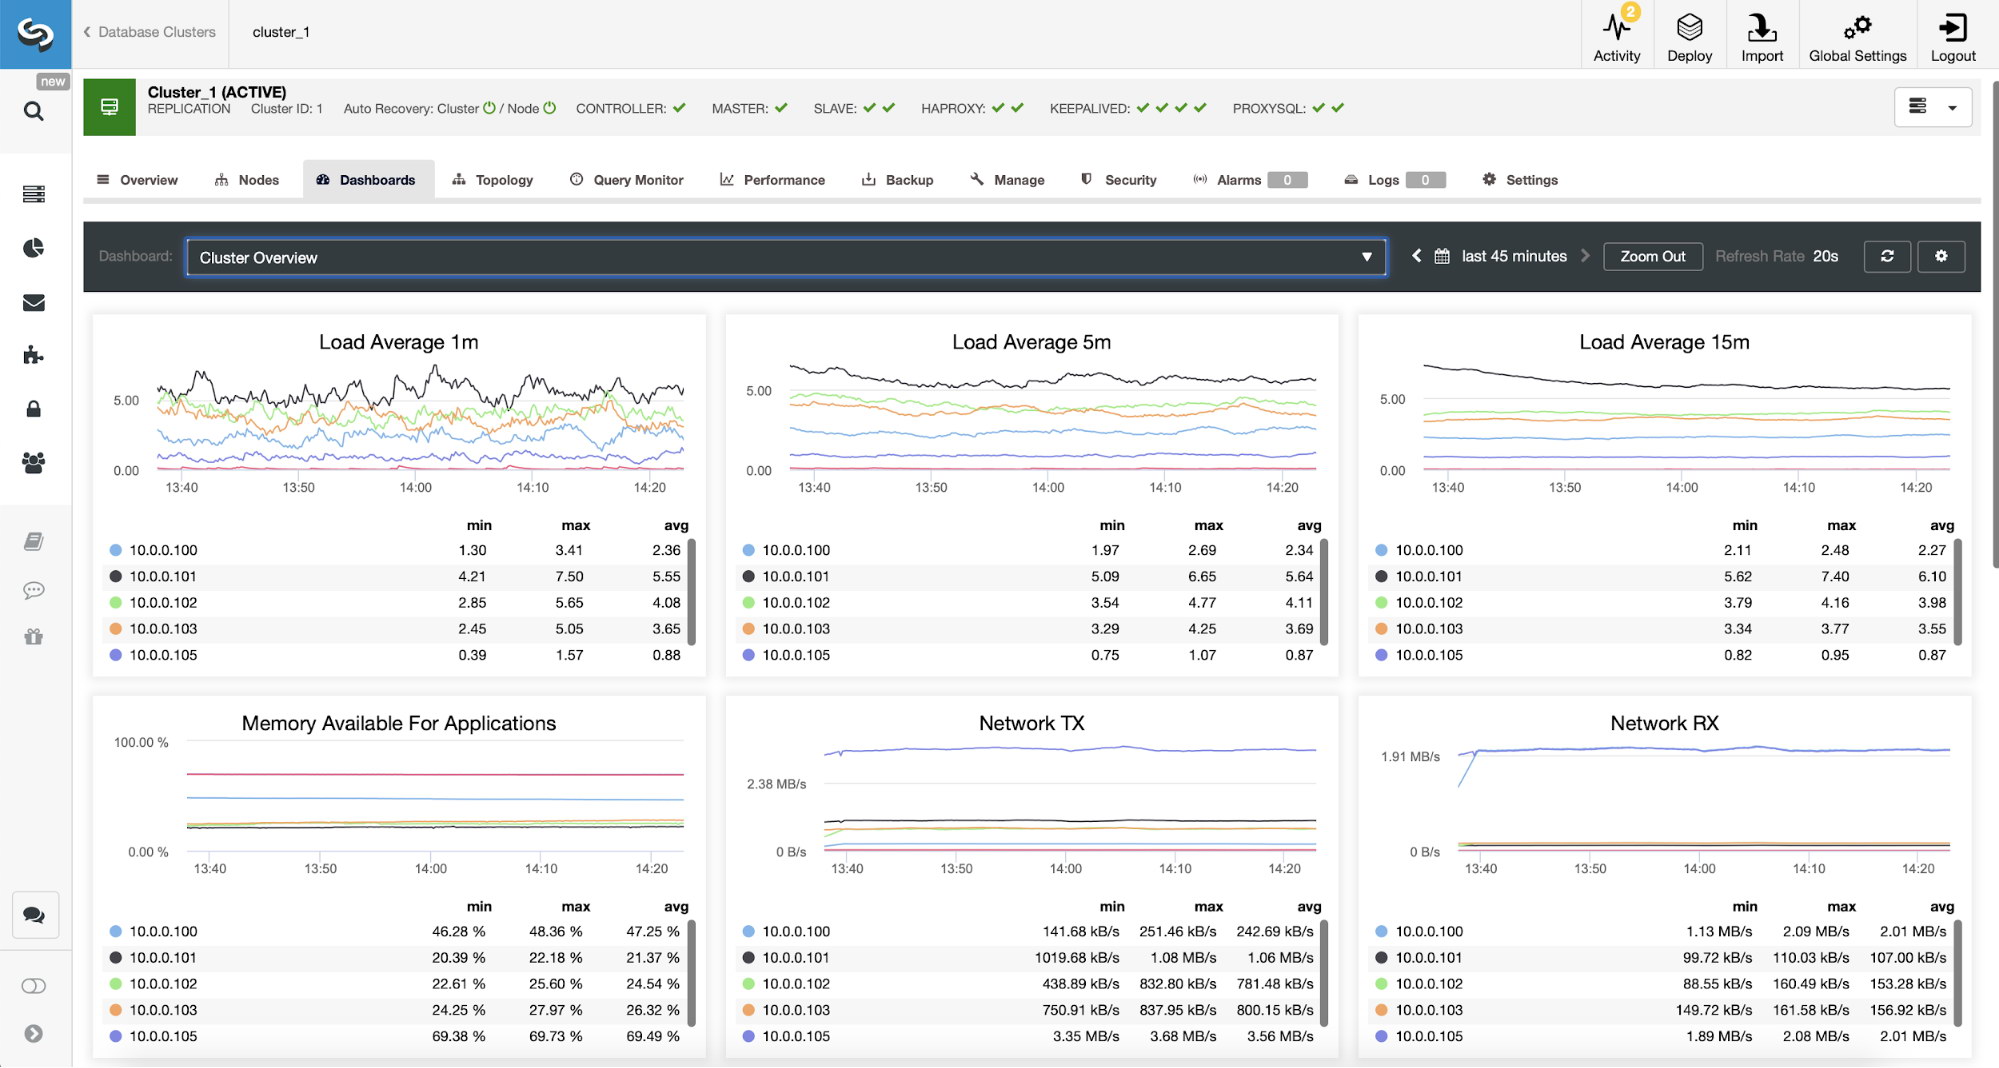
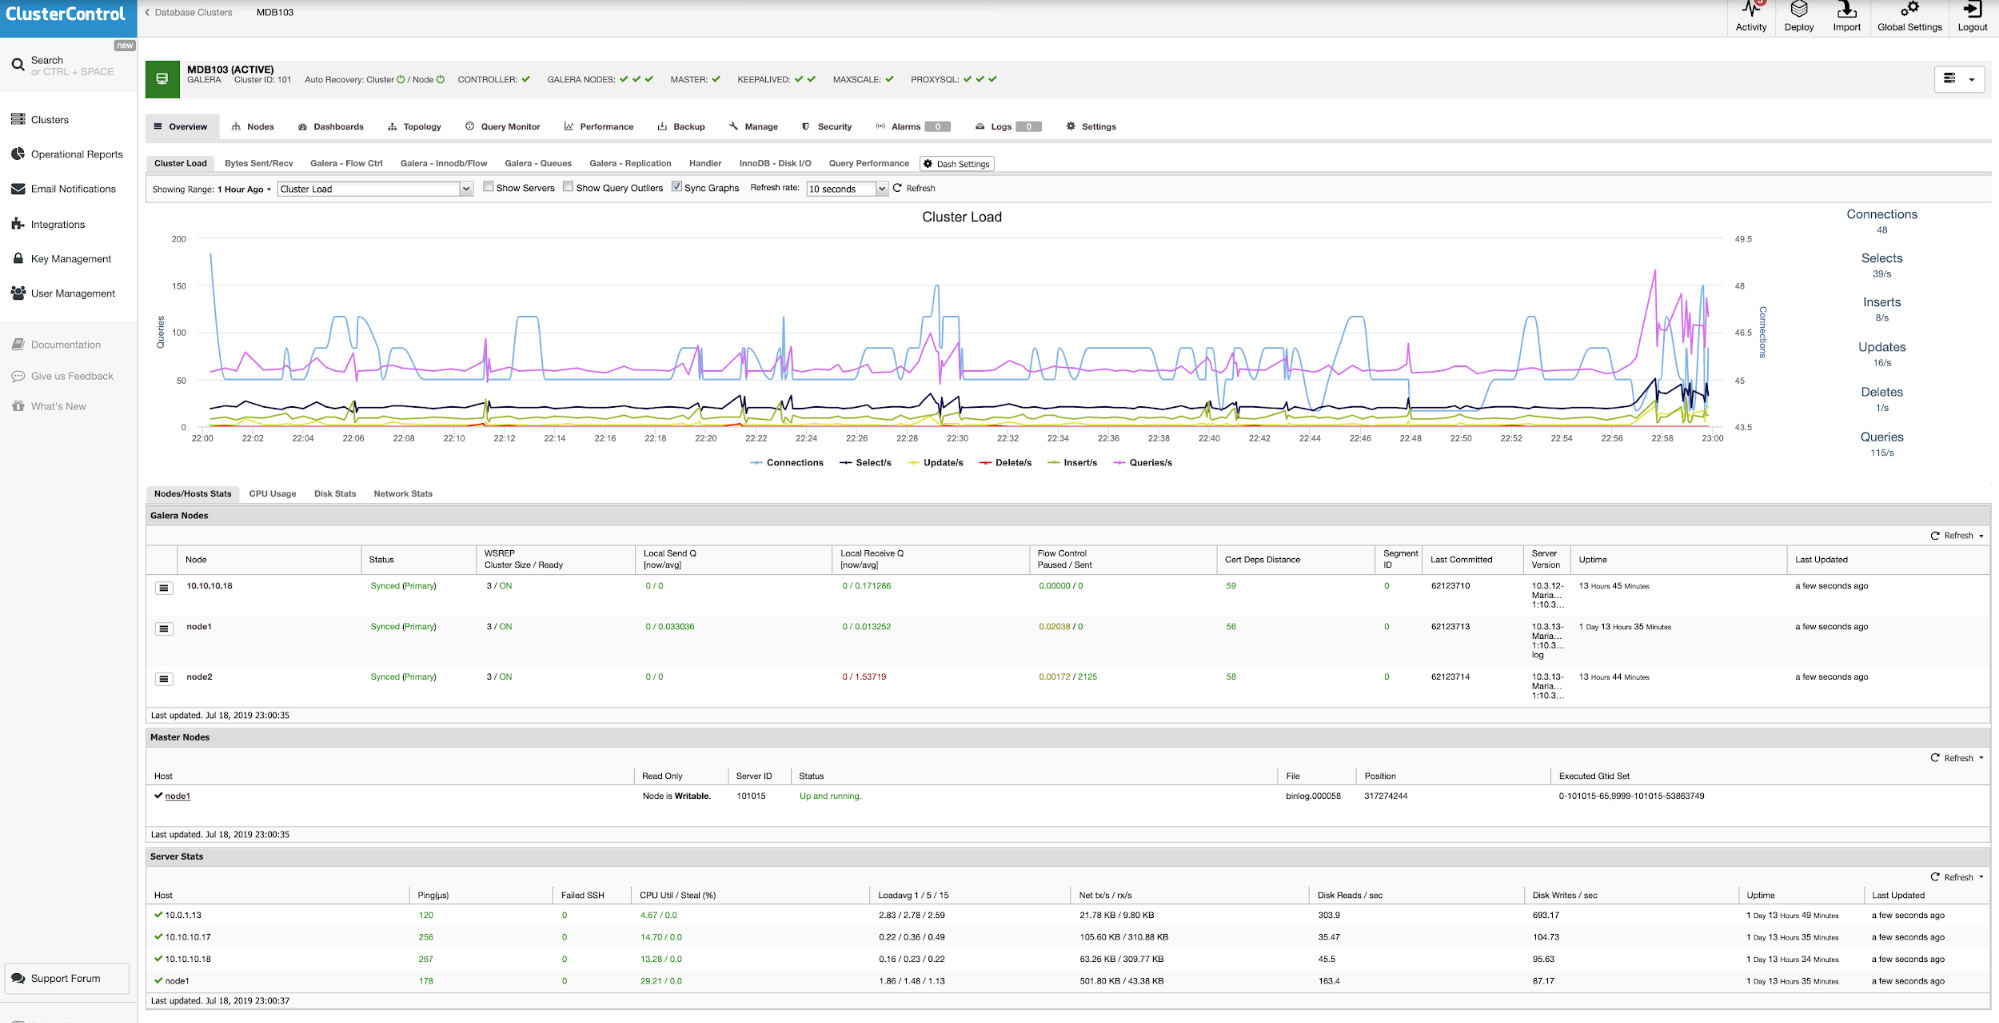
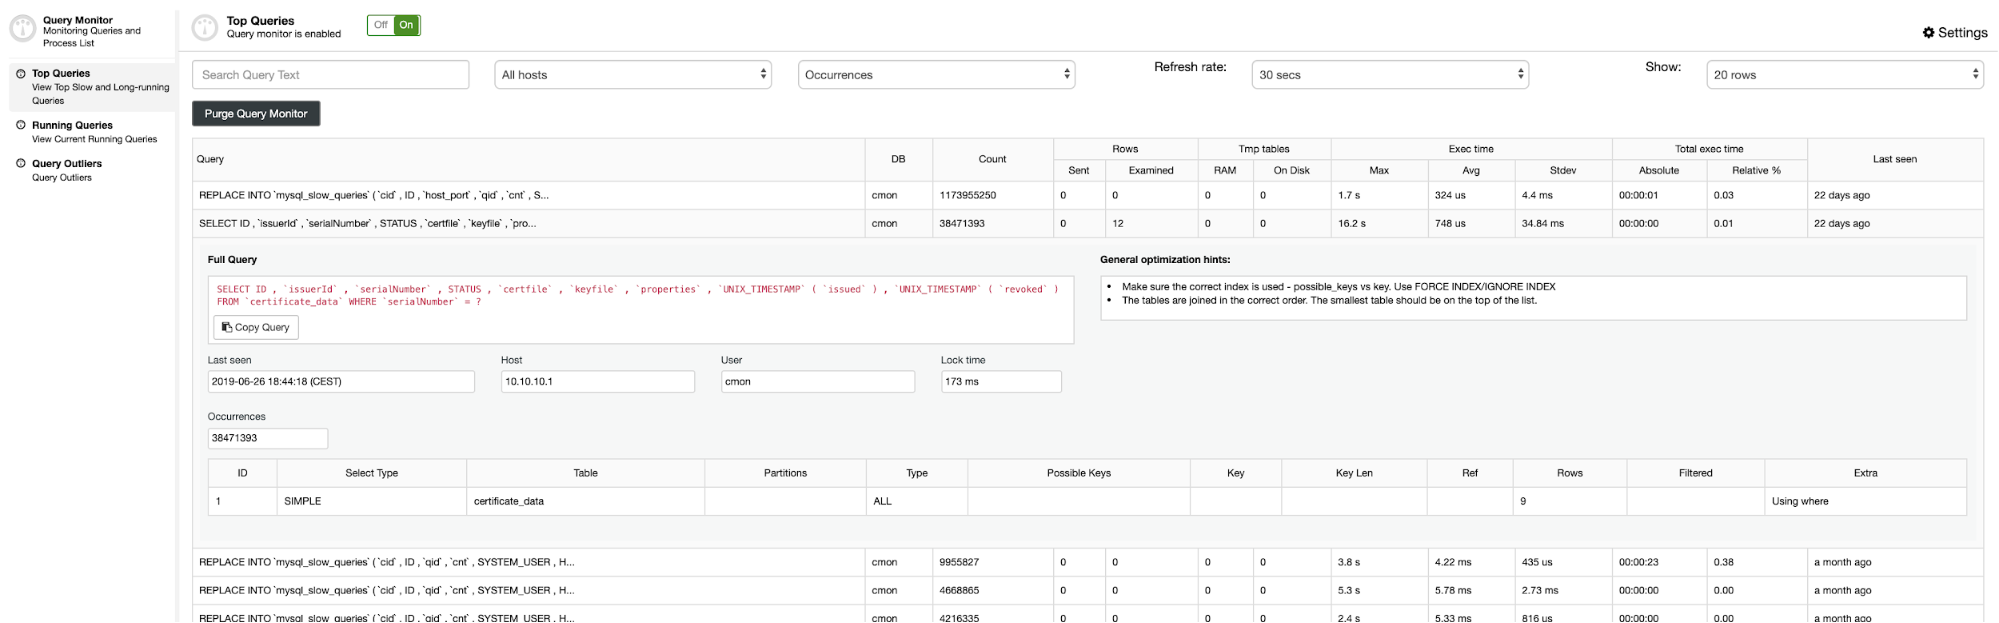
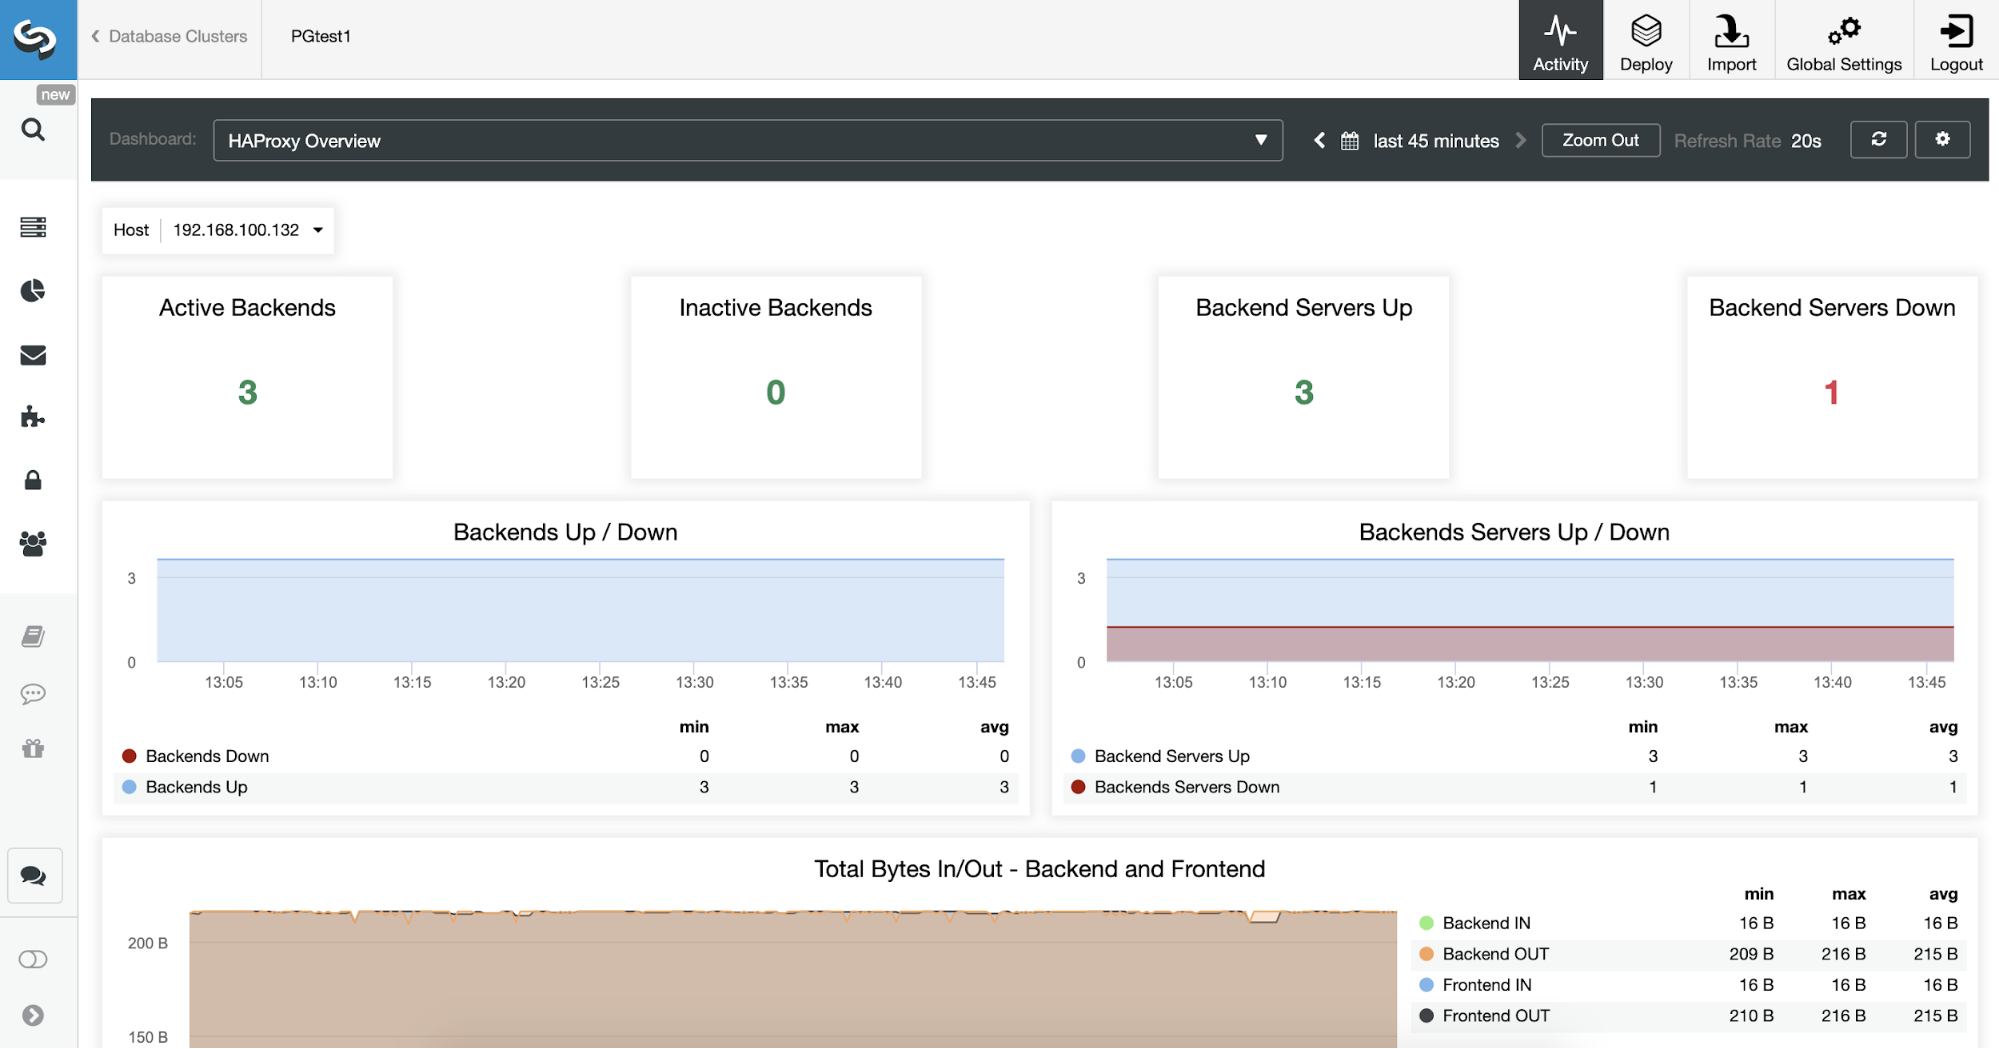
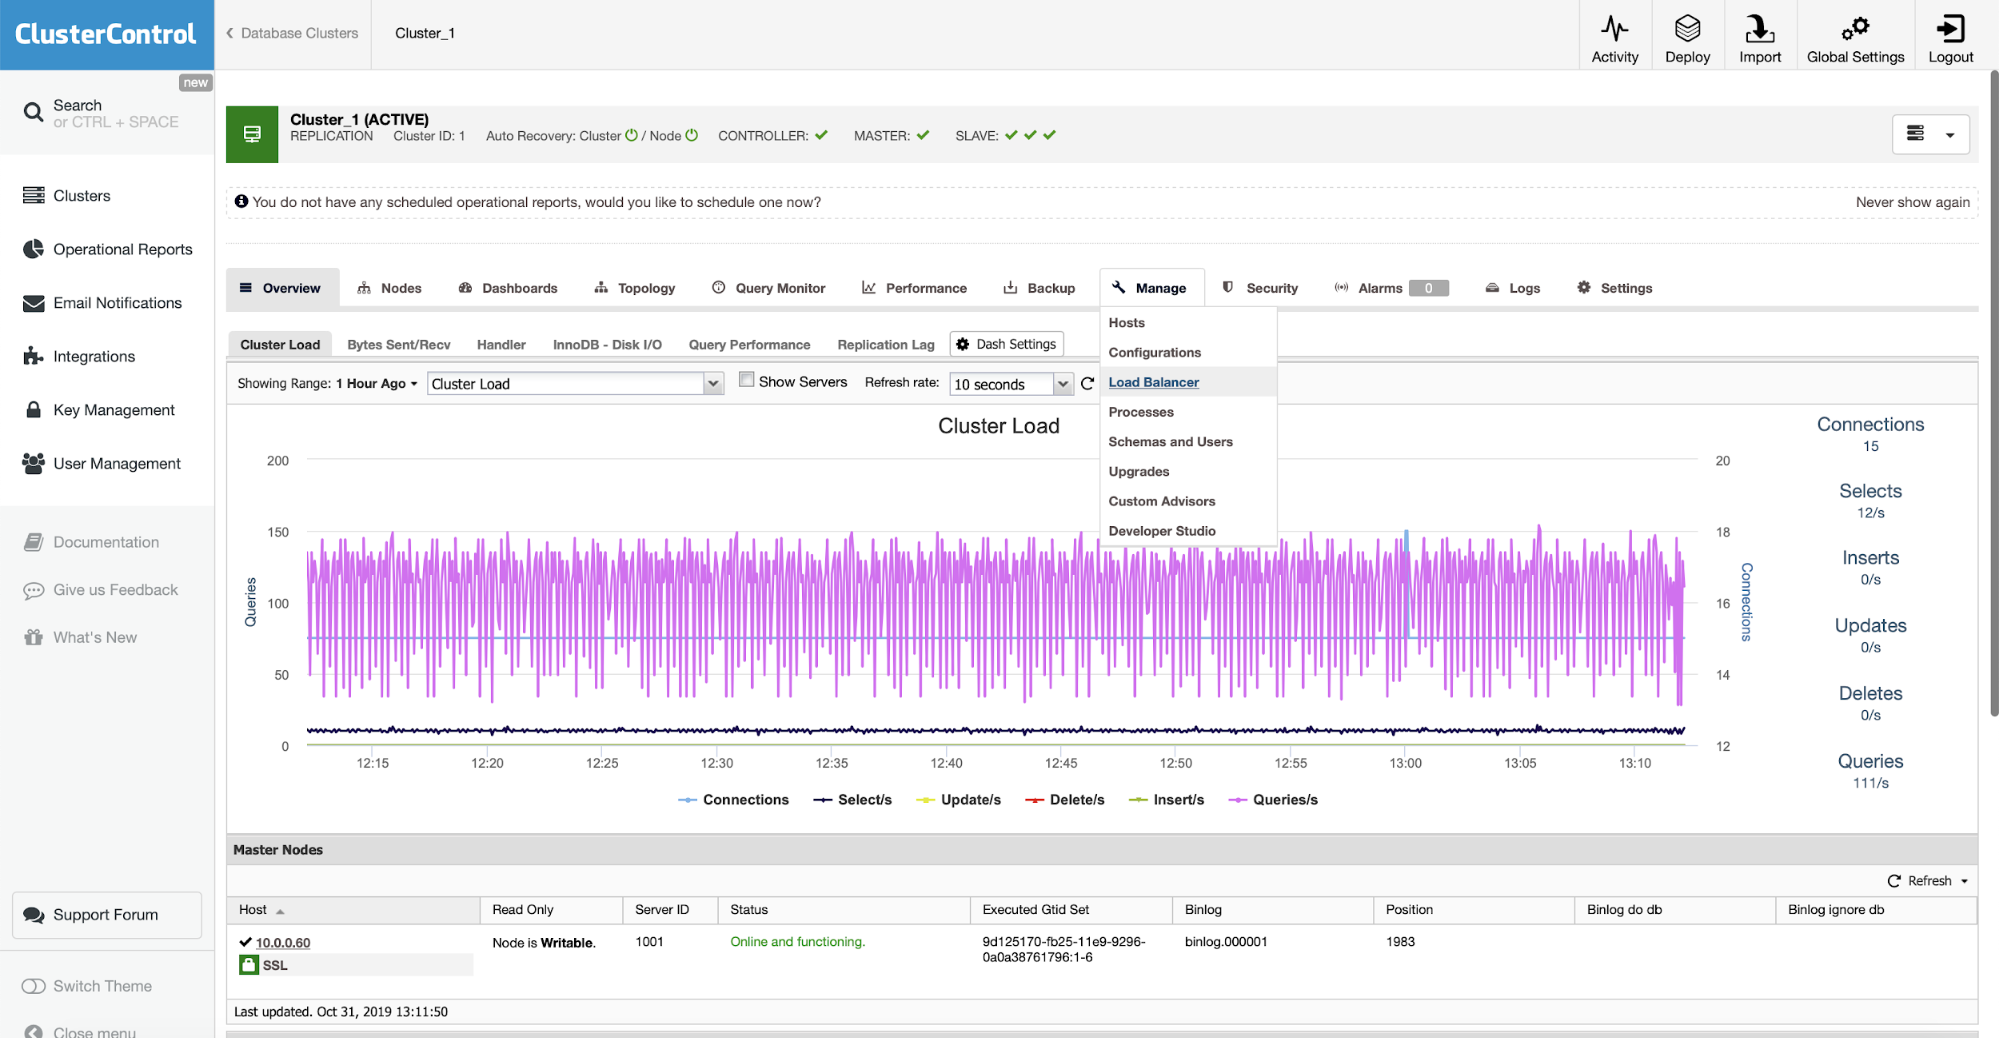
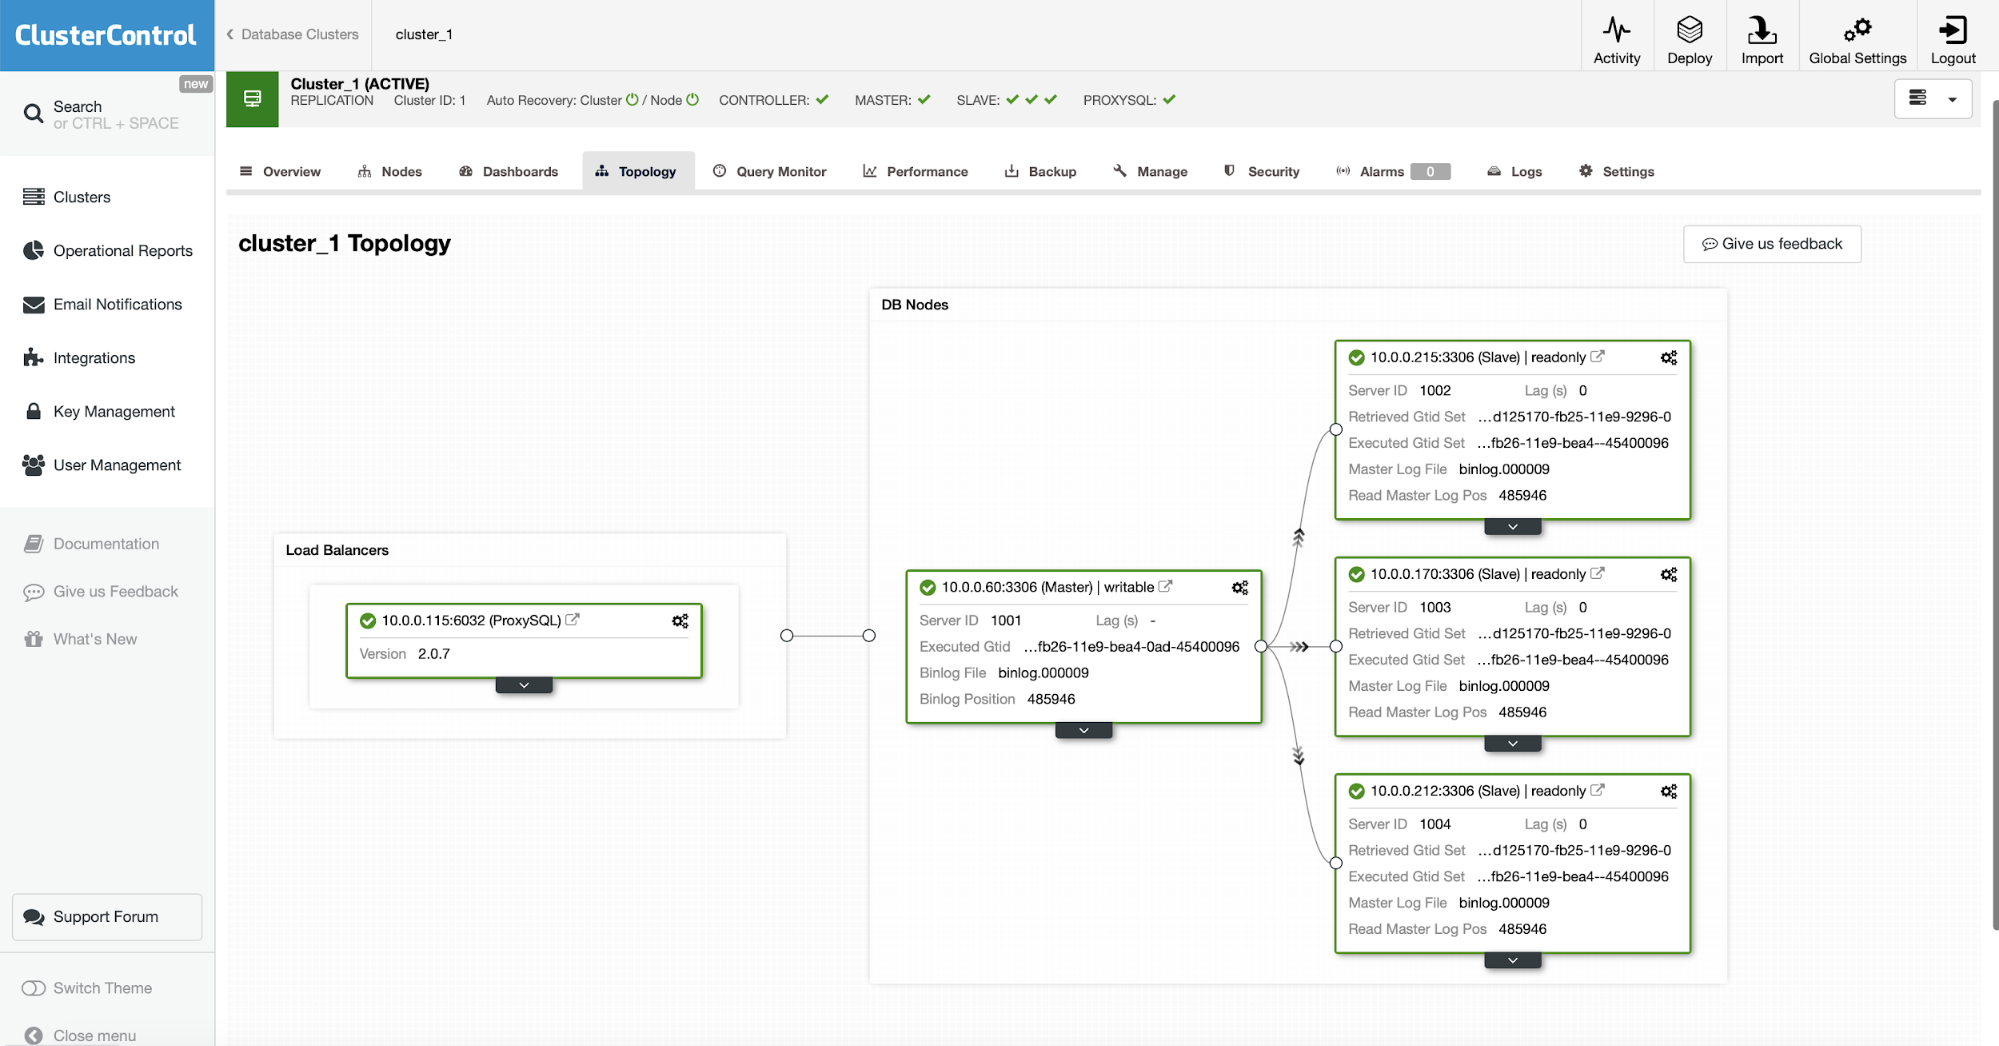
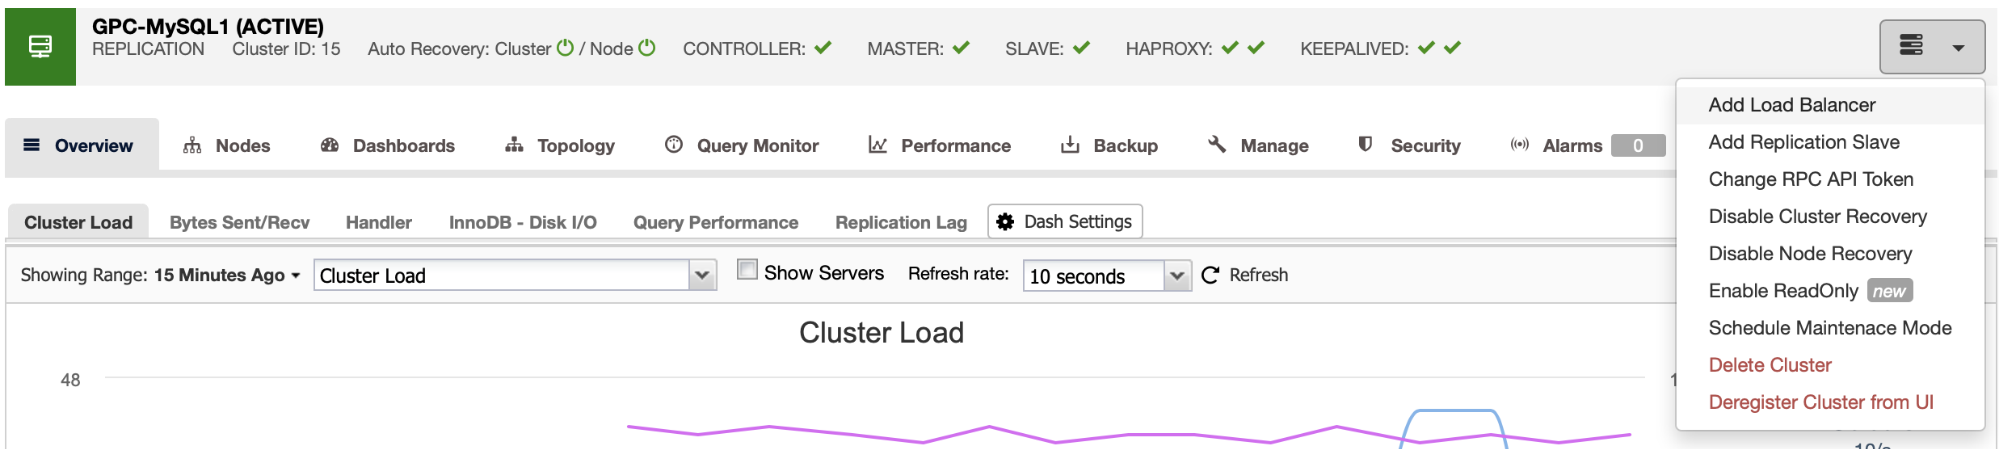
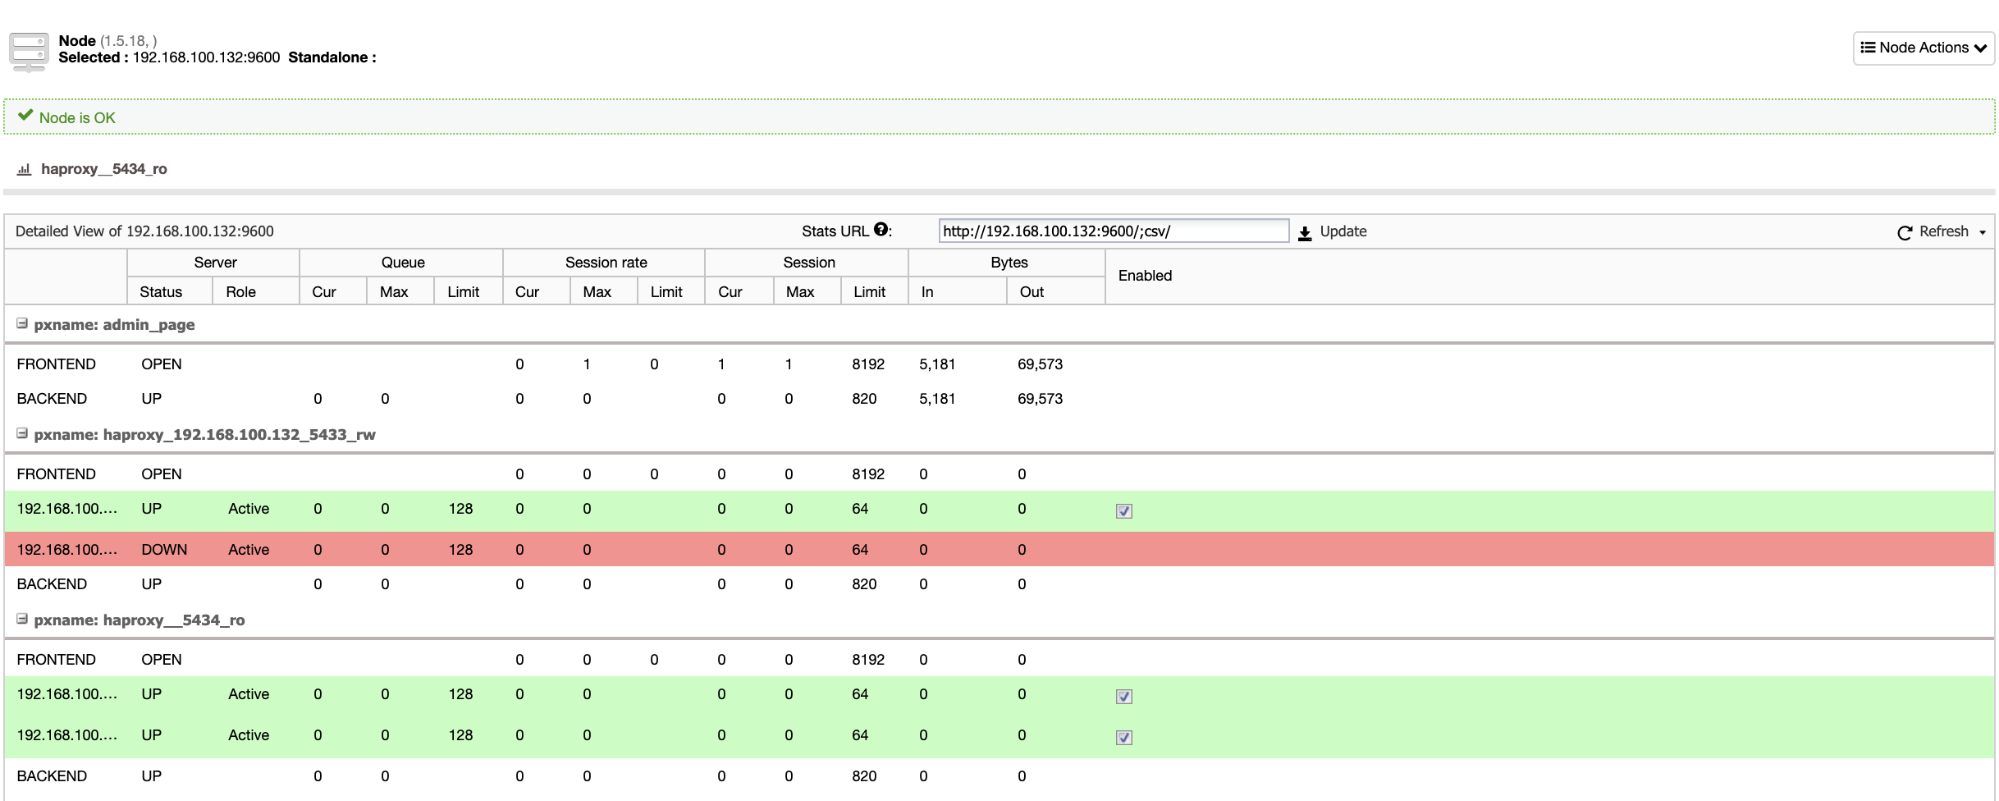
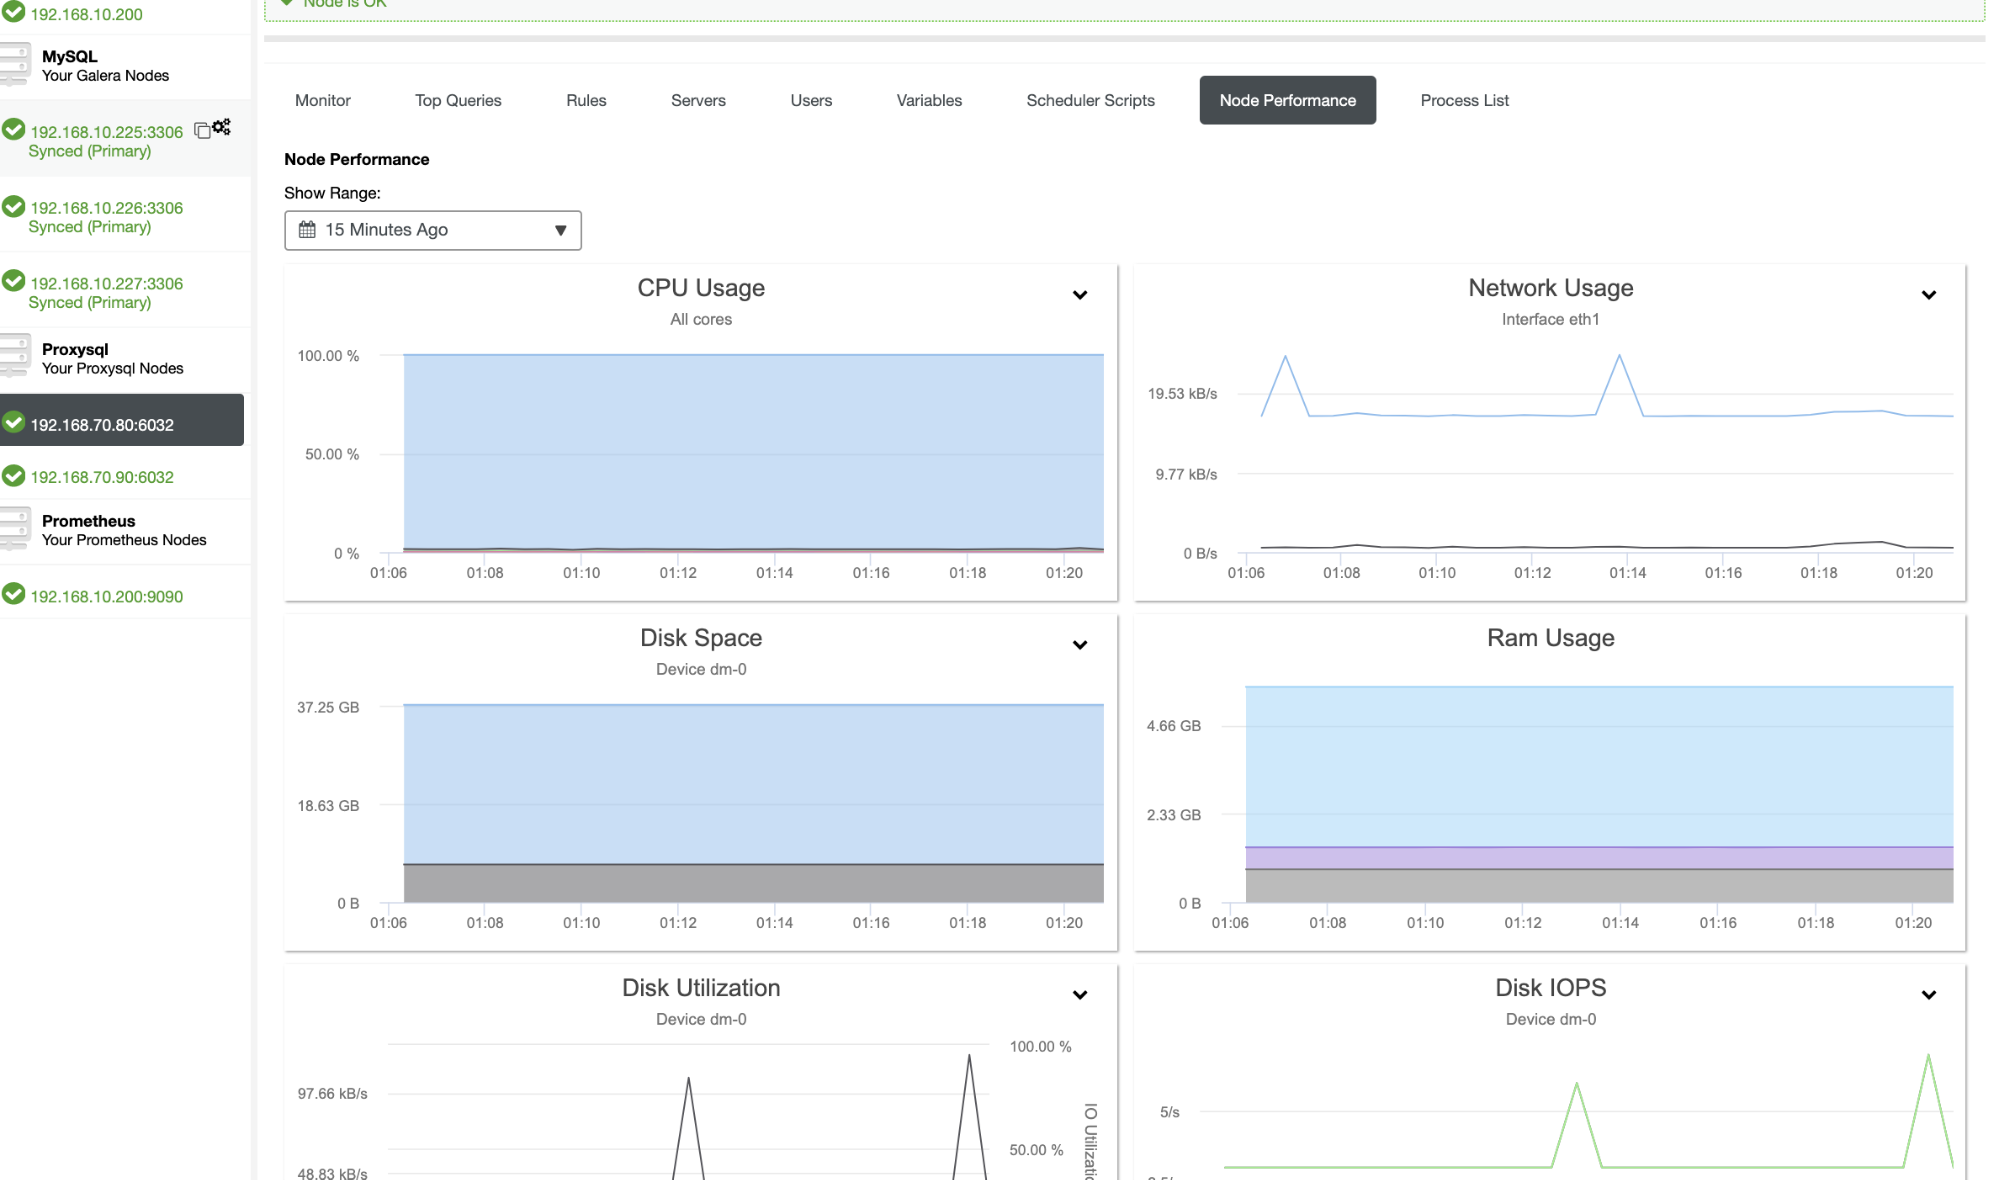
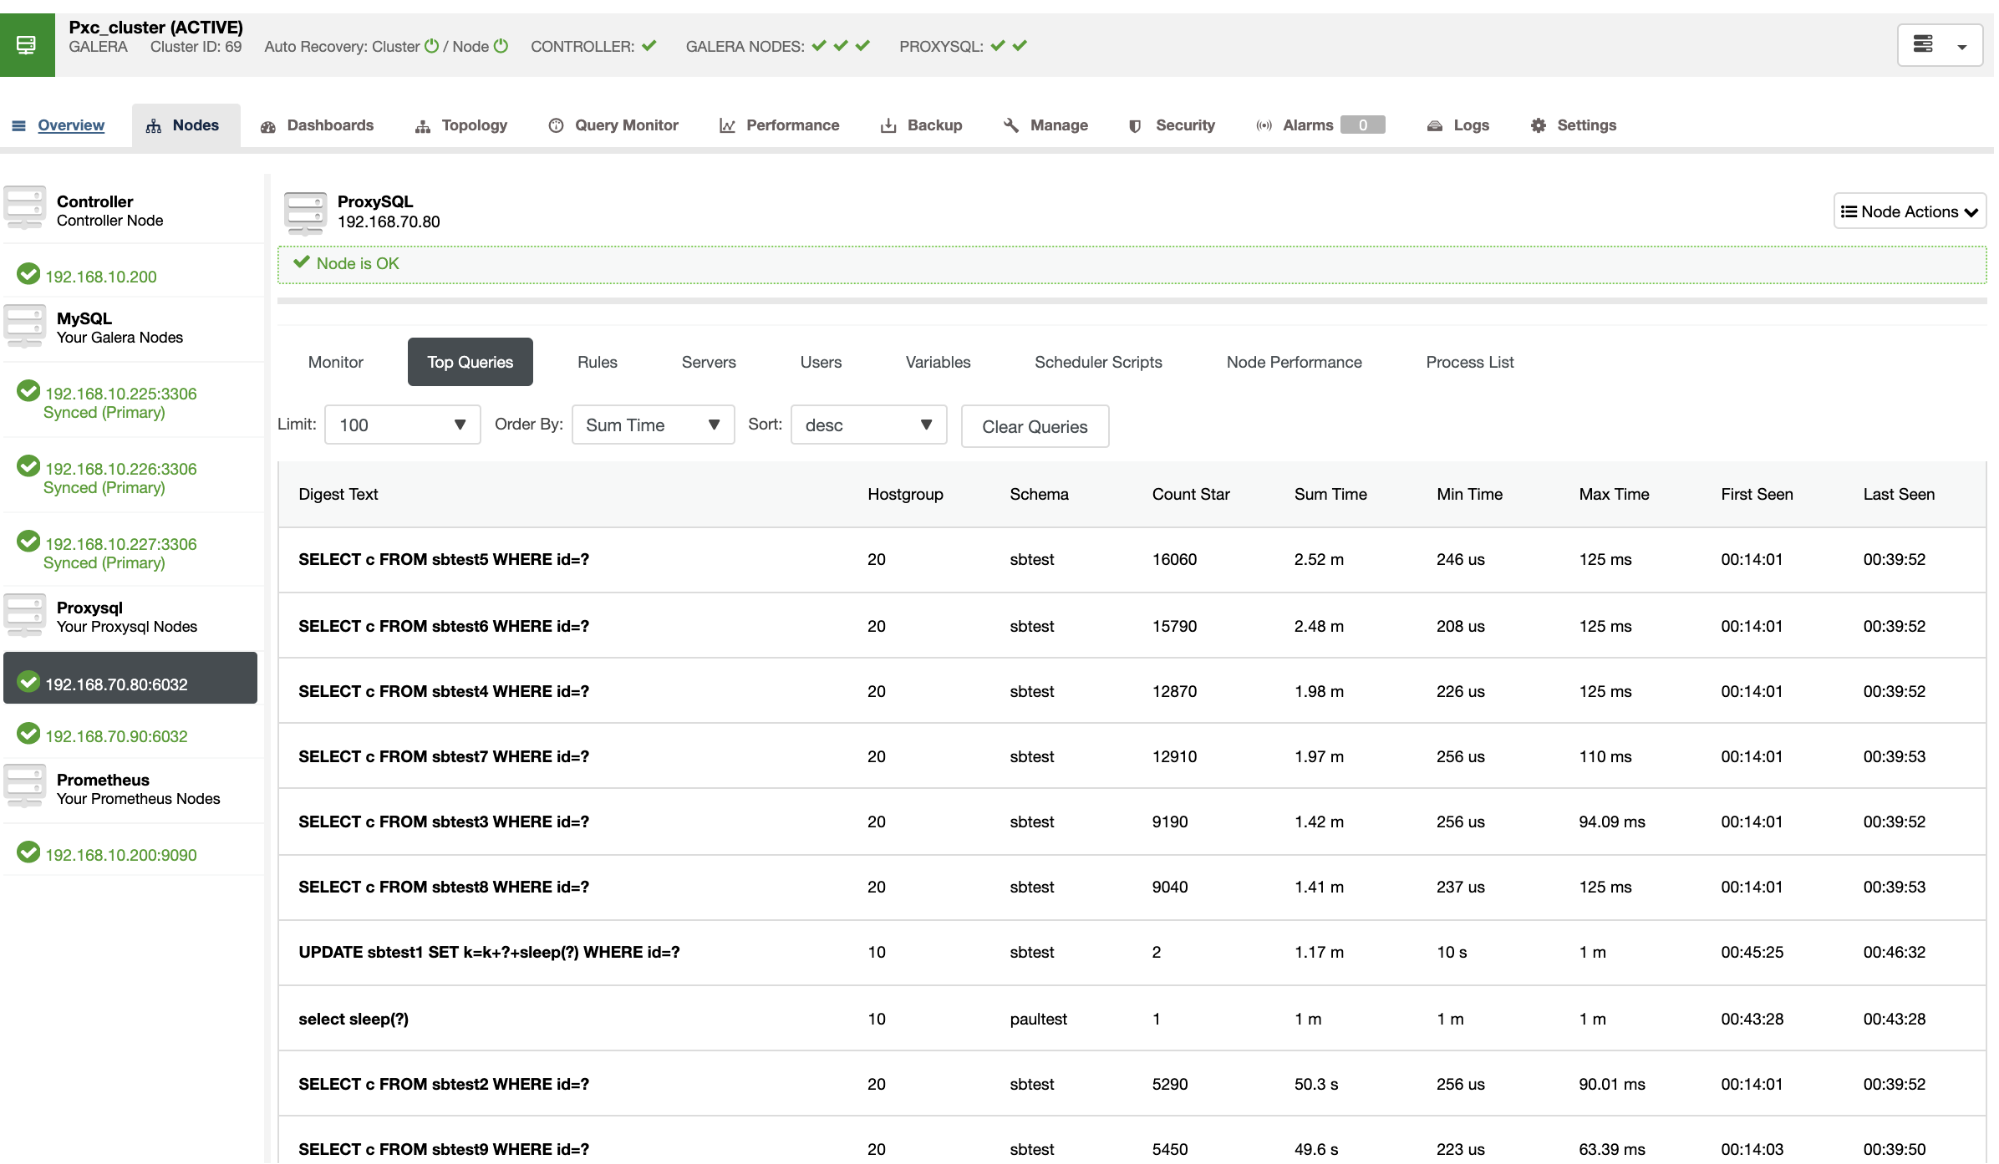
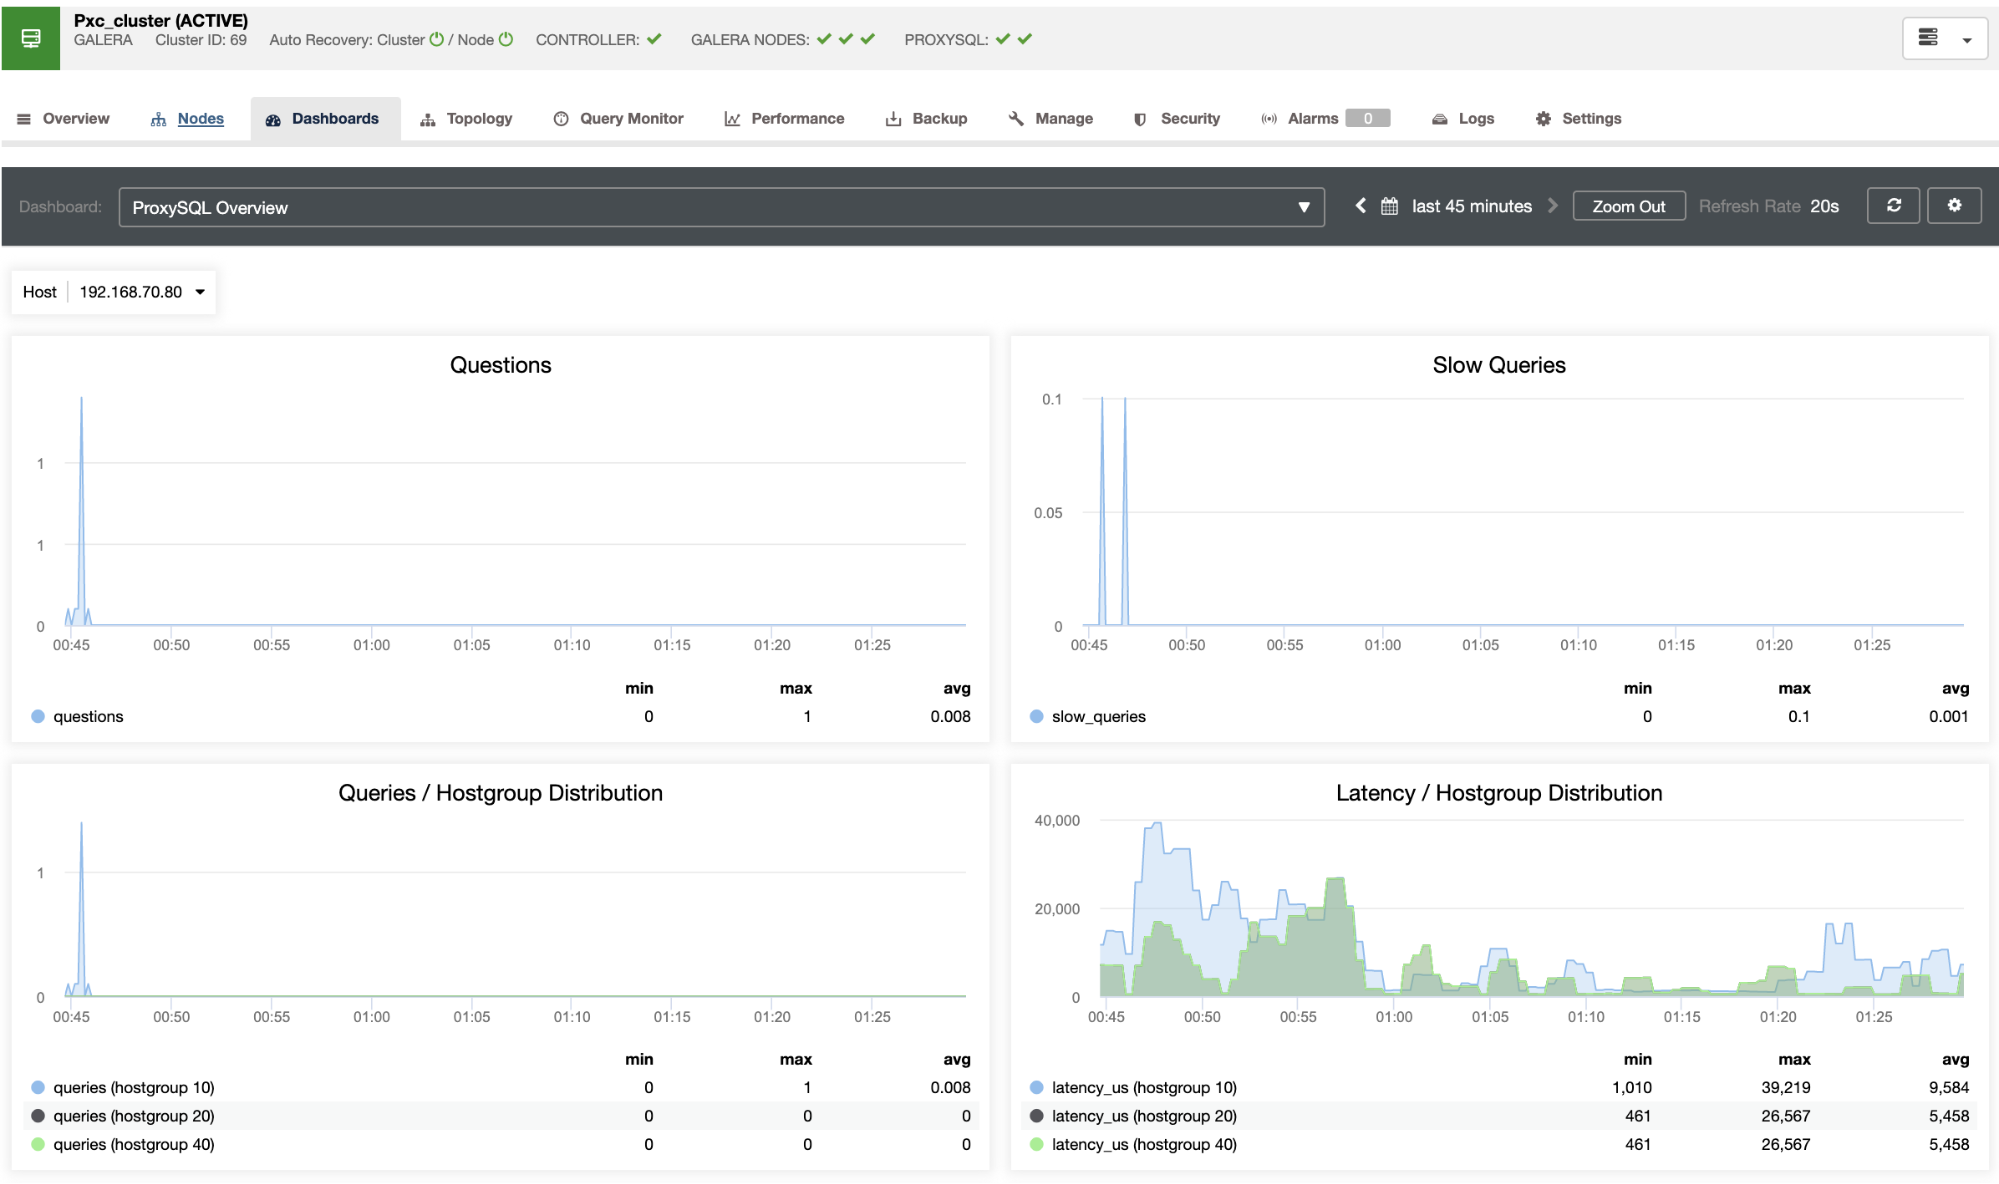
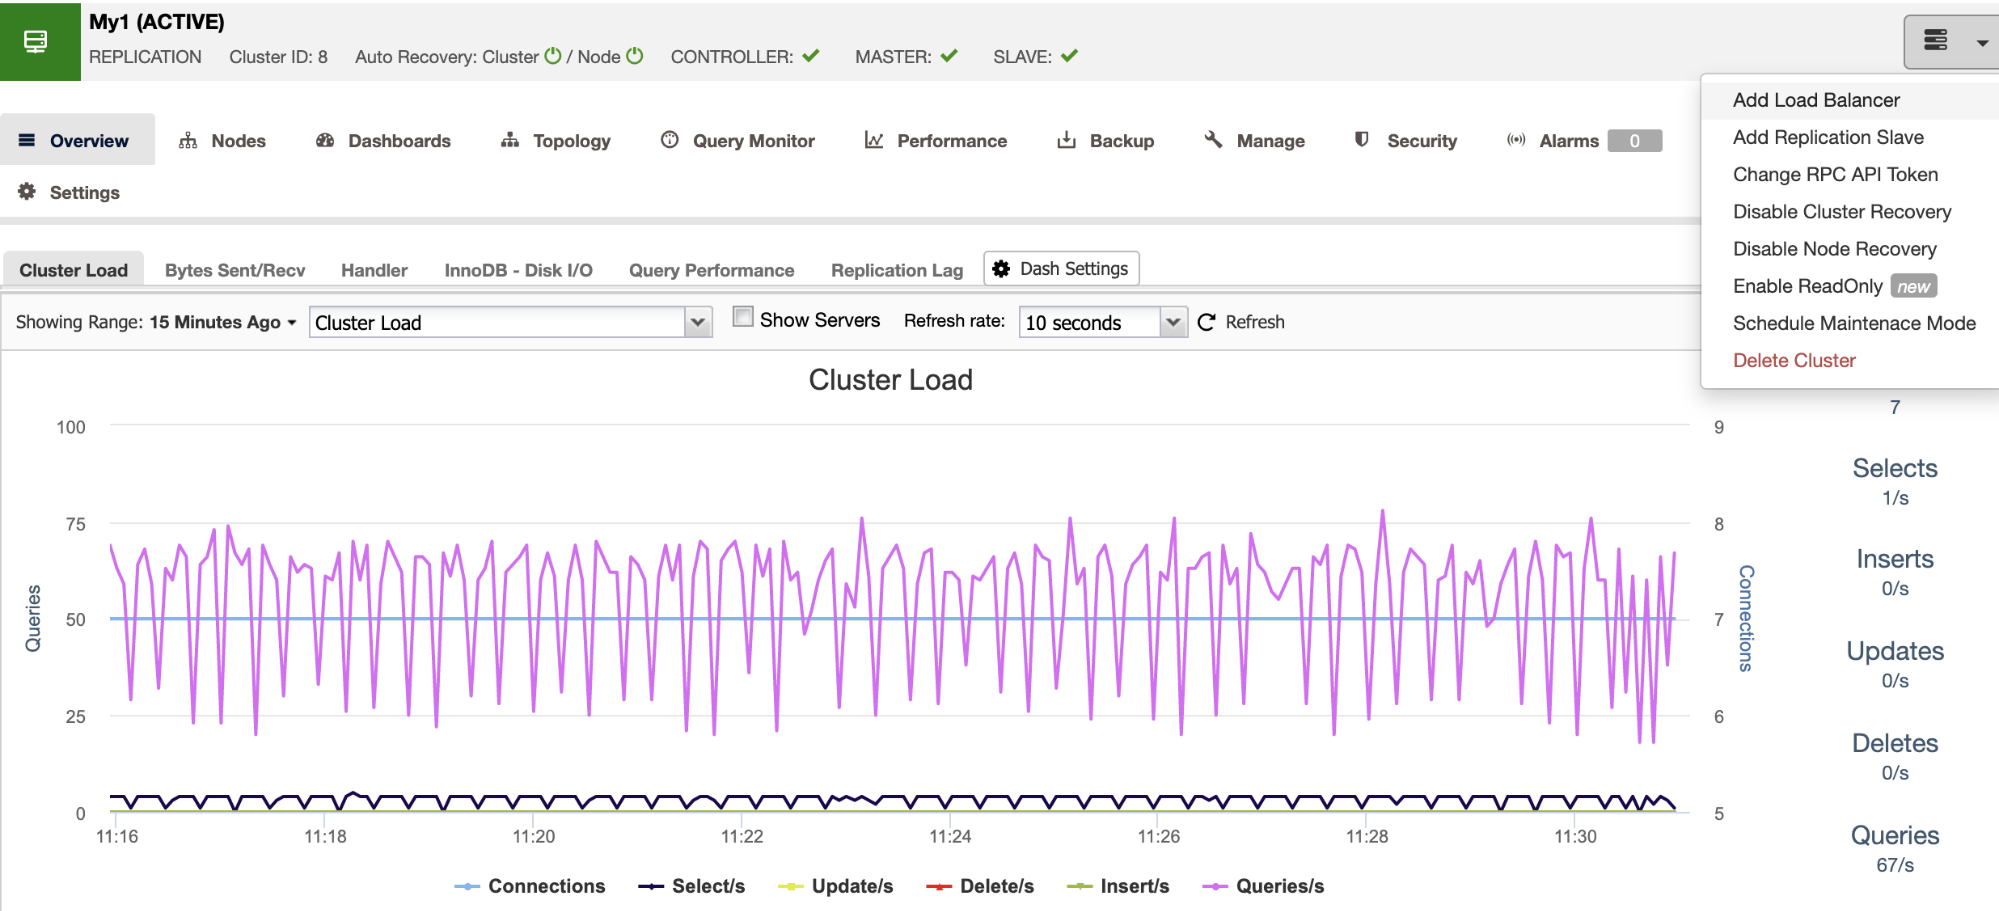
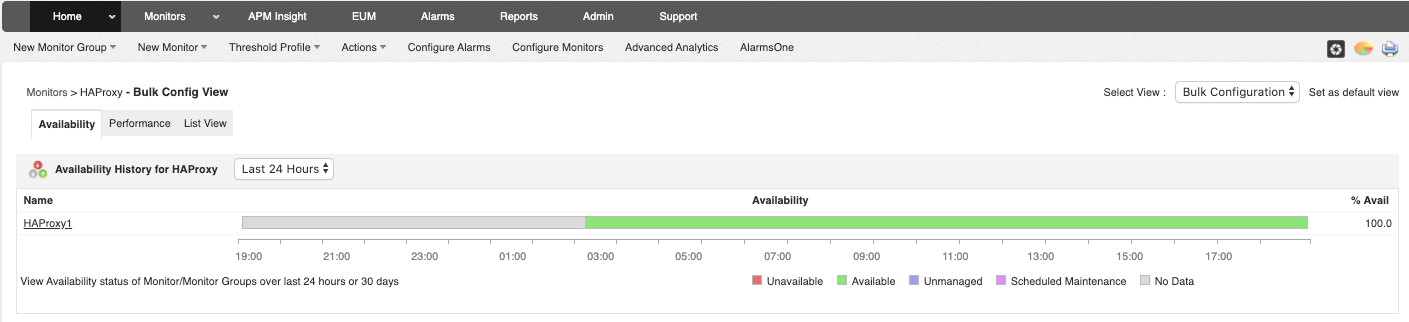
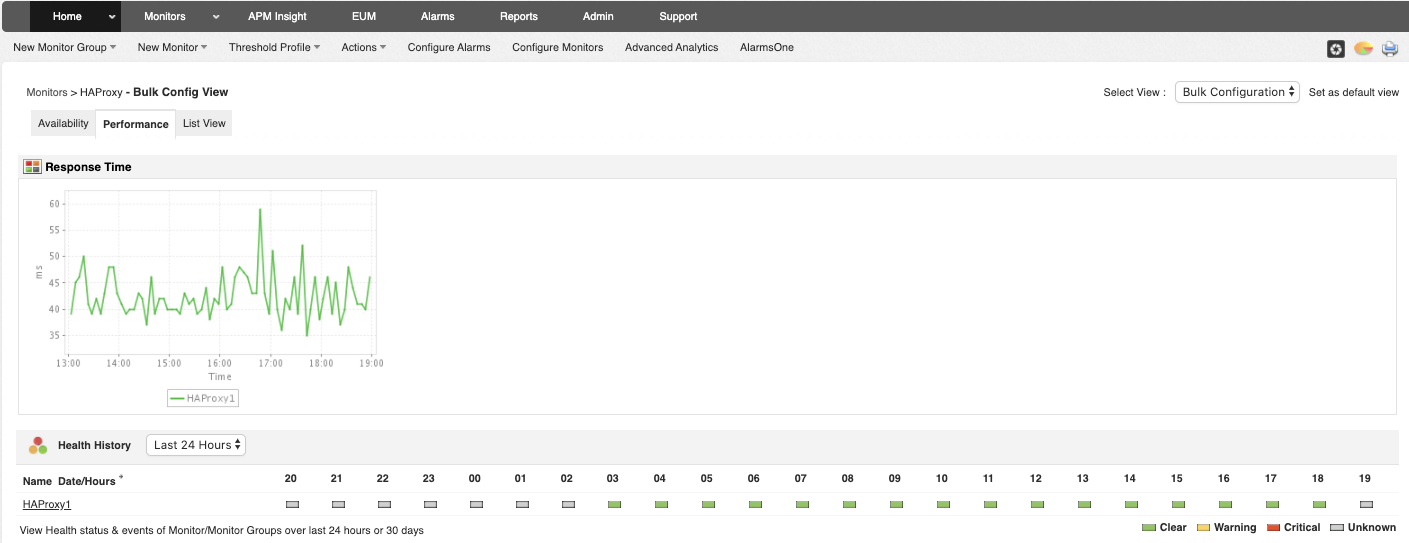
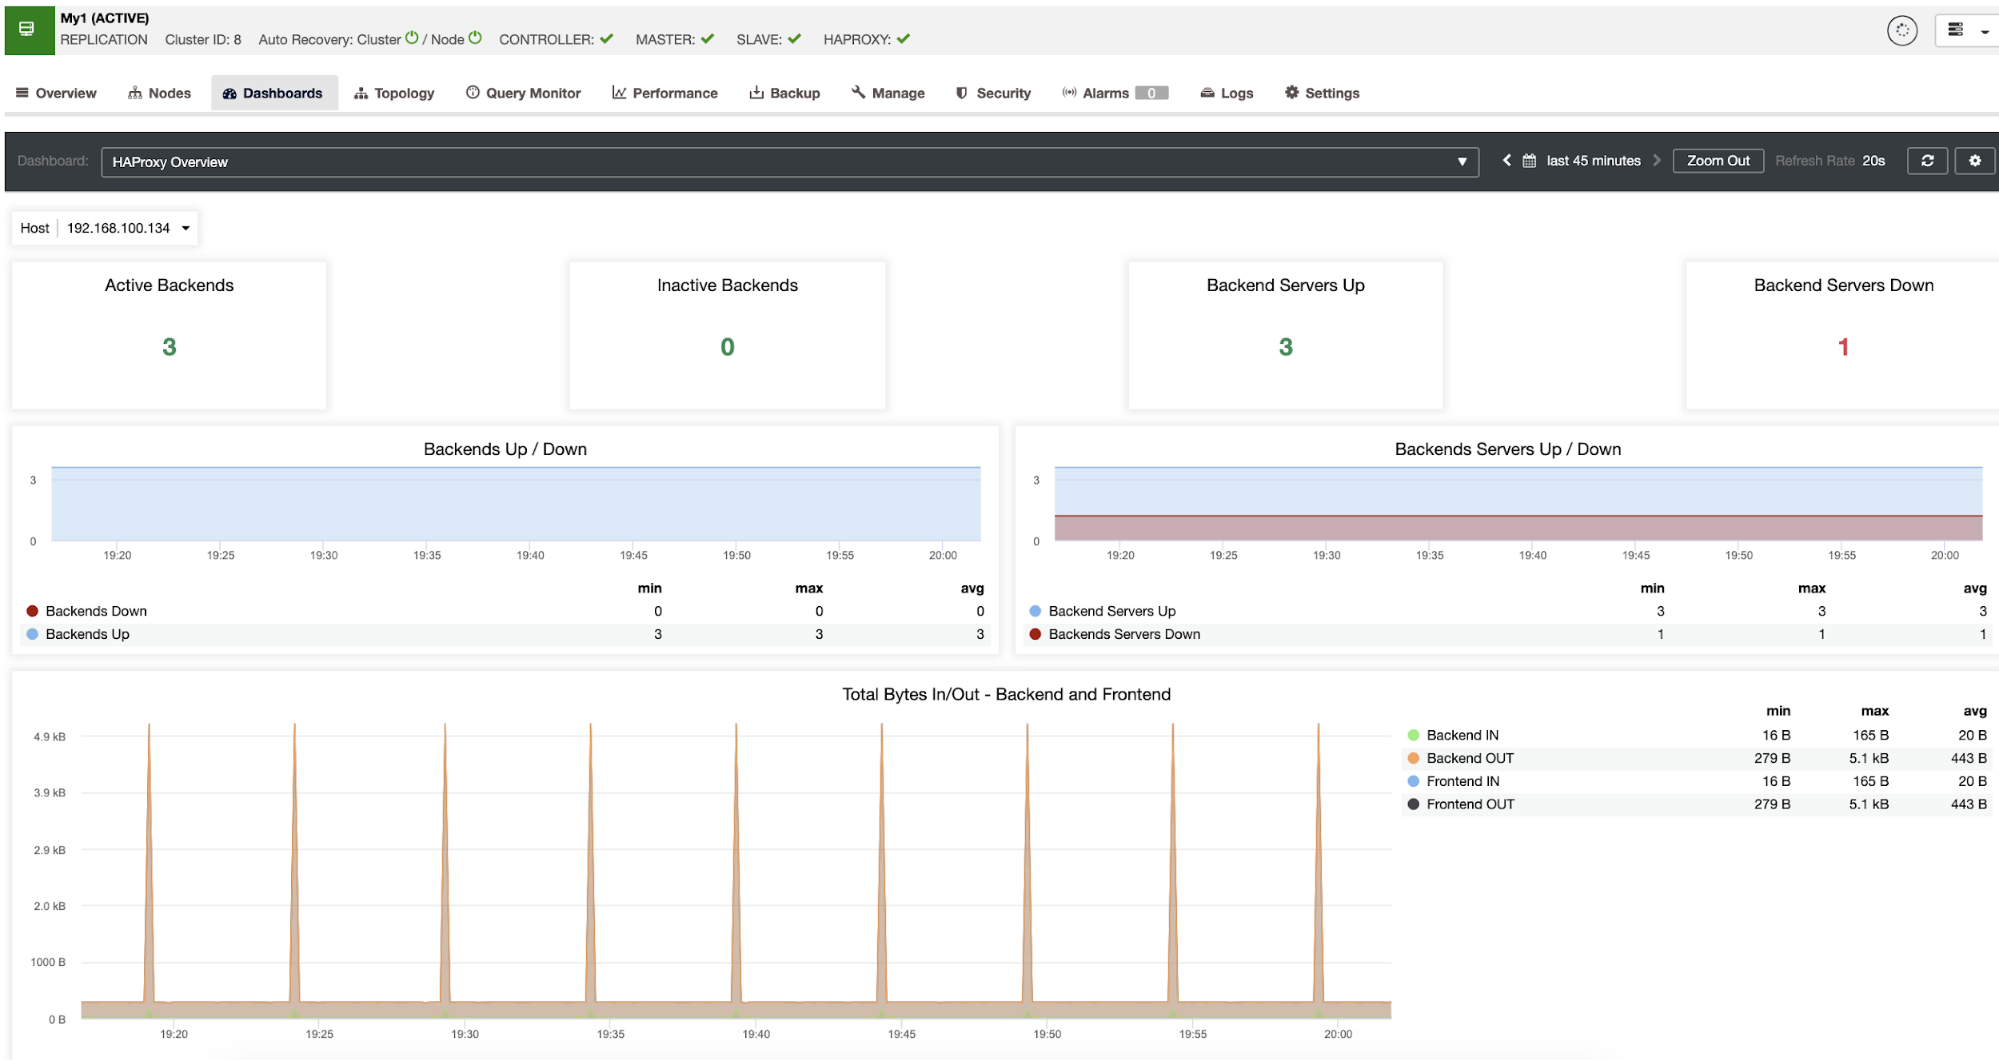
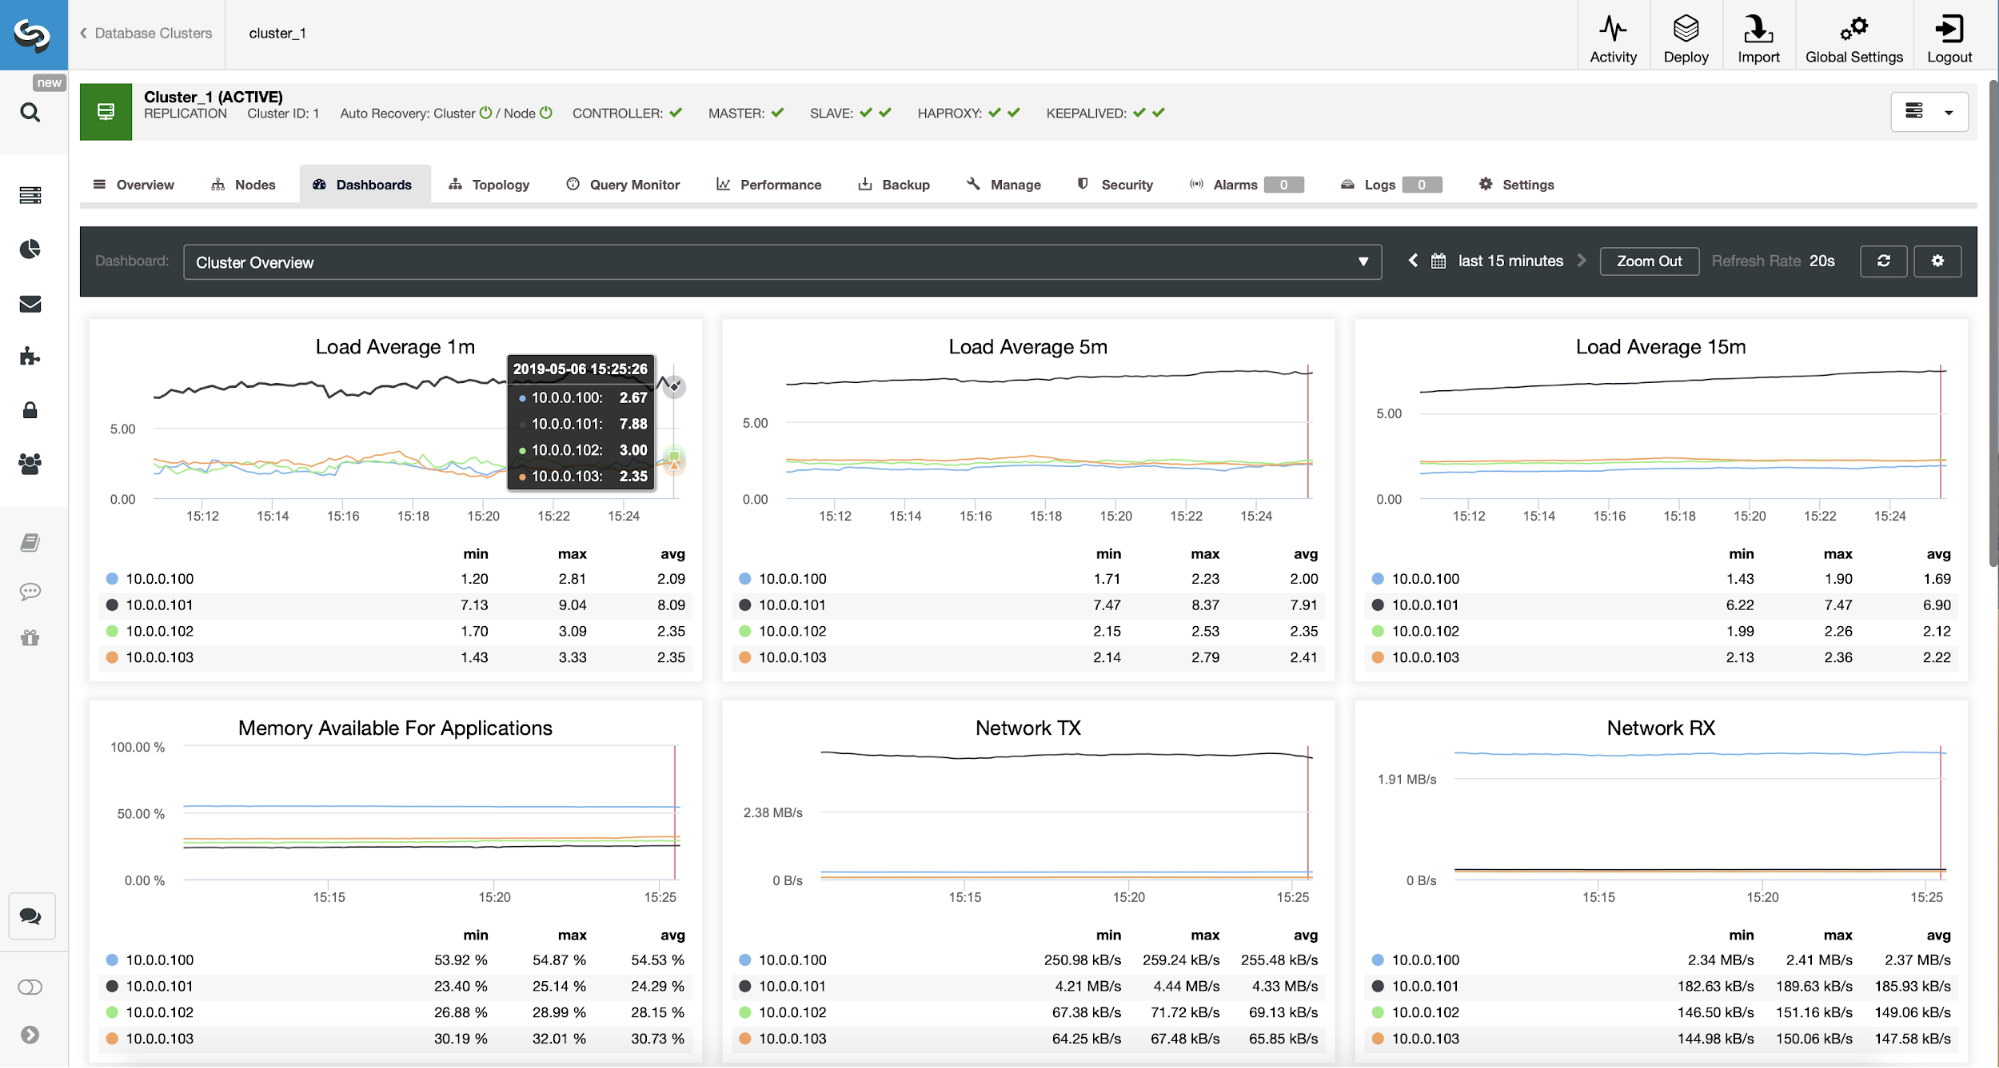
We can verify that the traffic has switched to ProxySQL by looking at the load graph - as you can see, load is much more distributed across the nodes in the cluster. You can also see it on the graph below, which shows the queries distribution across the cluster.

ProxySQL Dashboard in ClusterControl

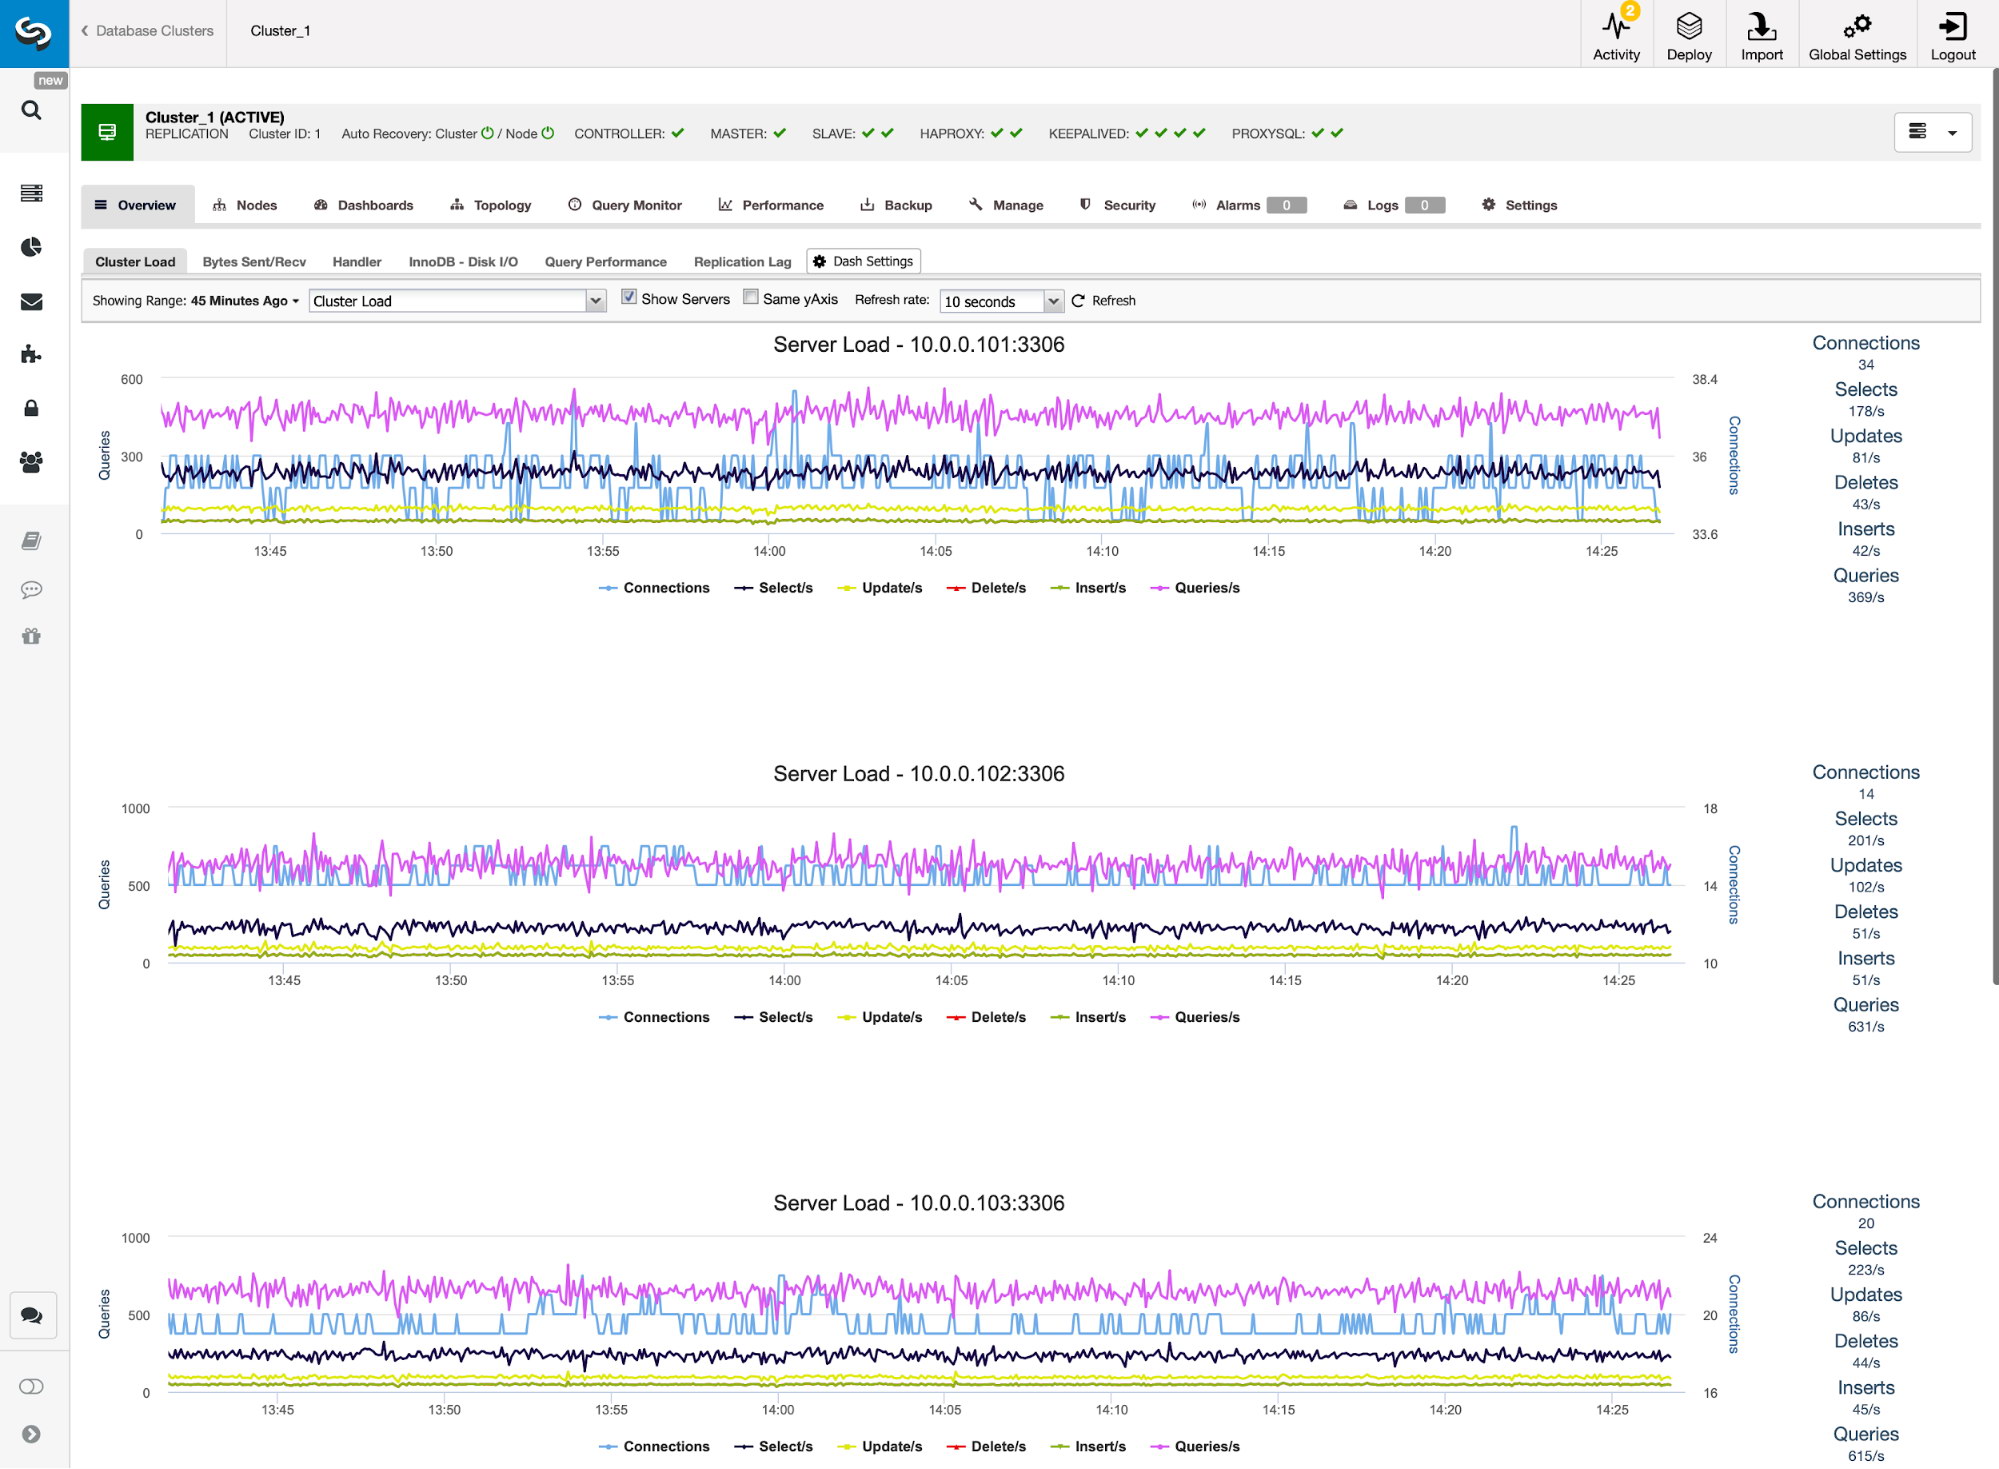
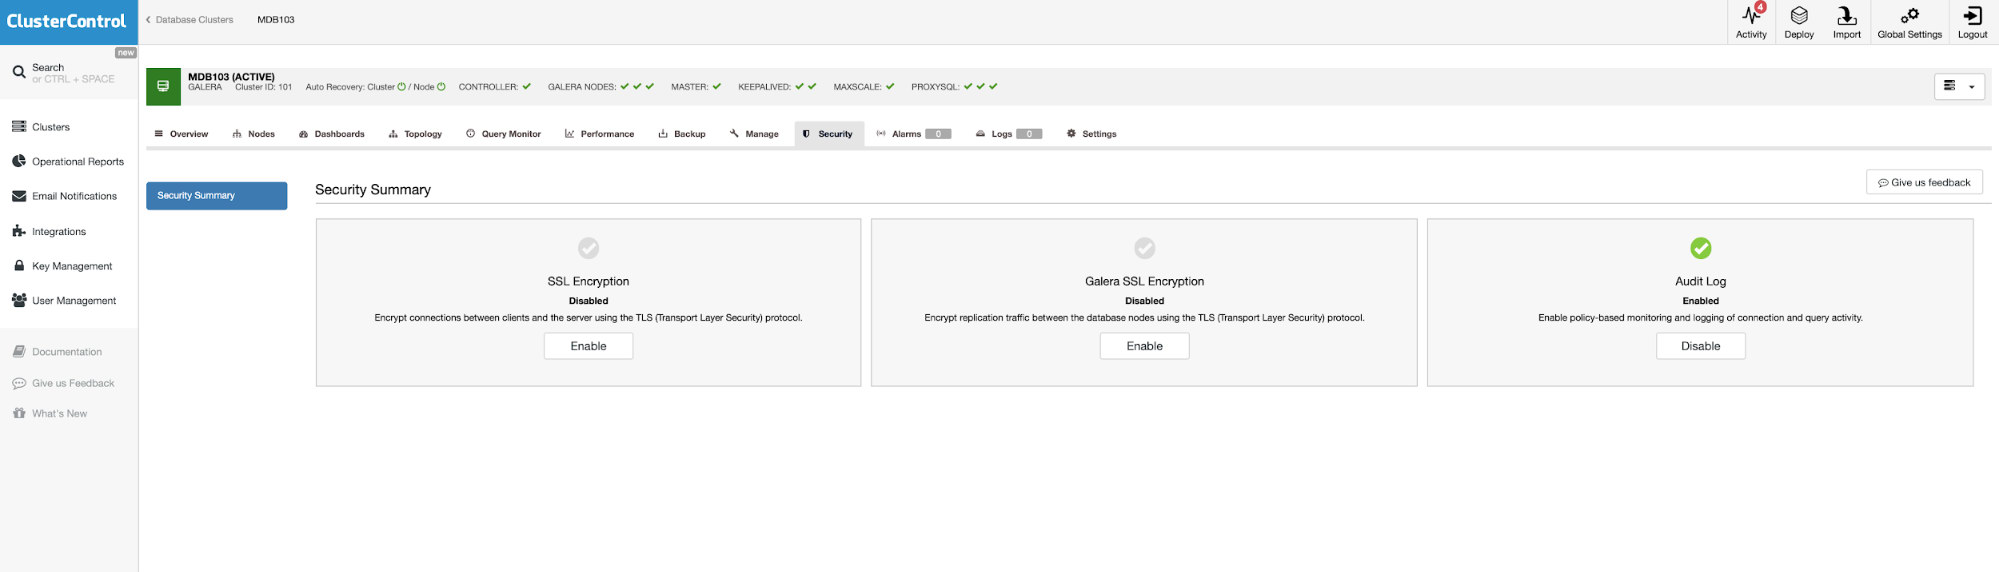
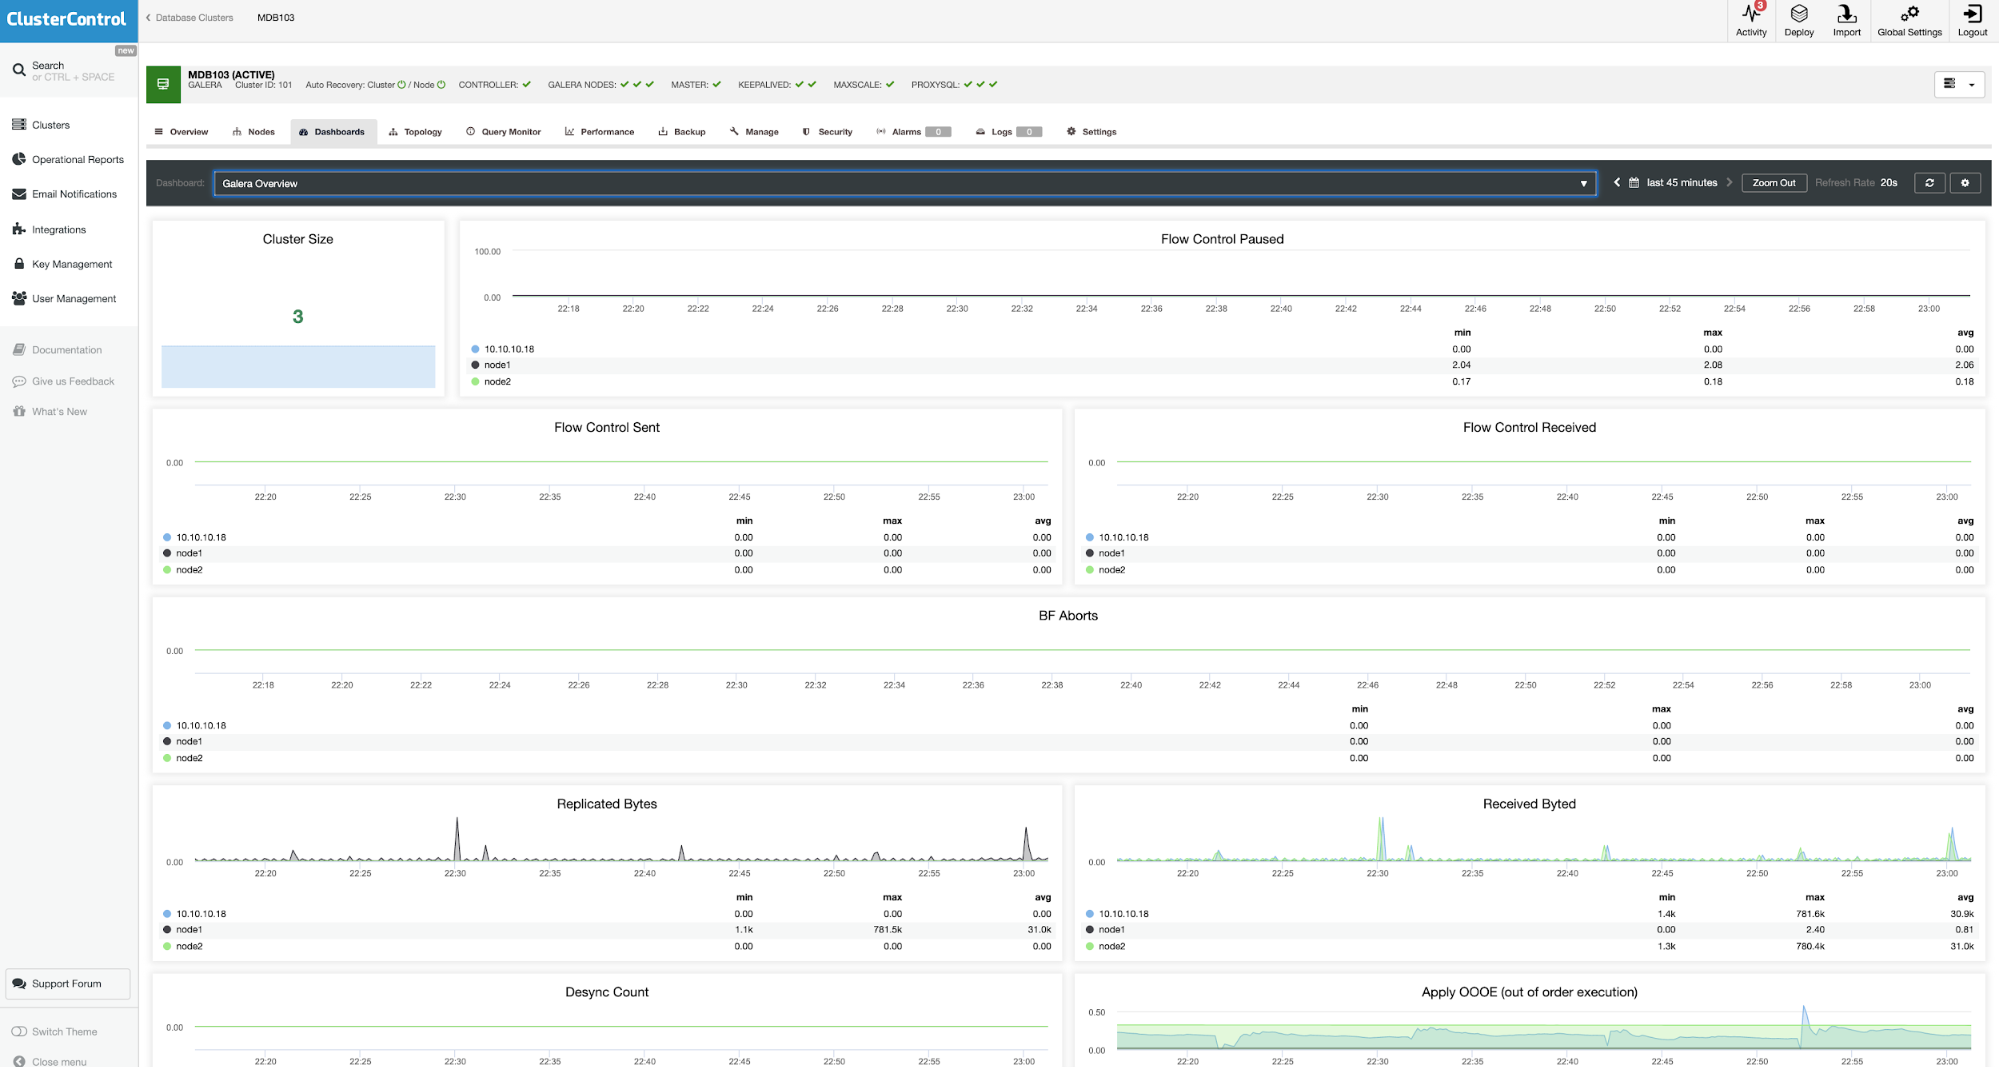
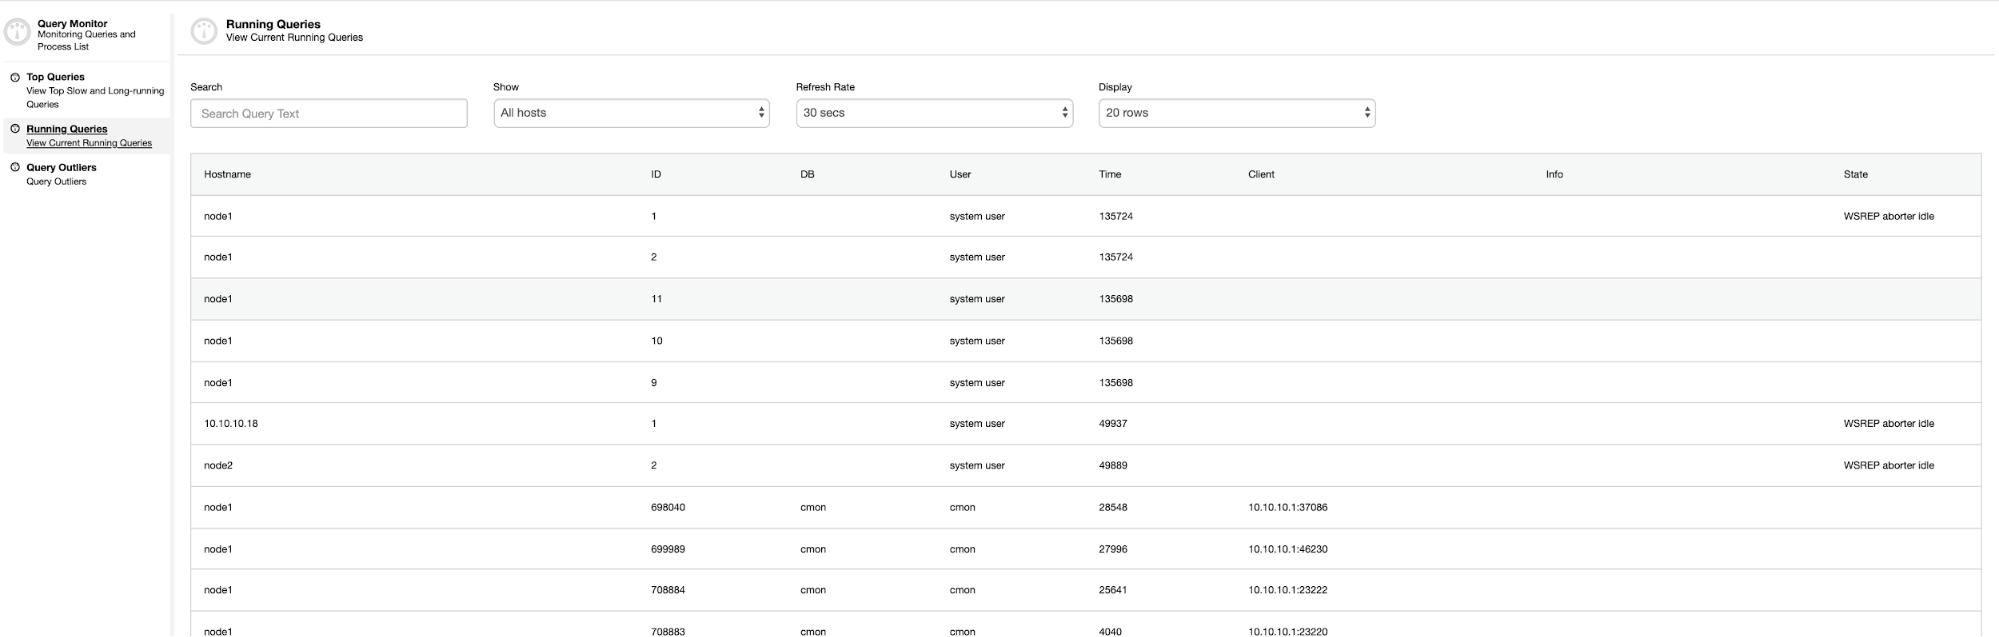
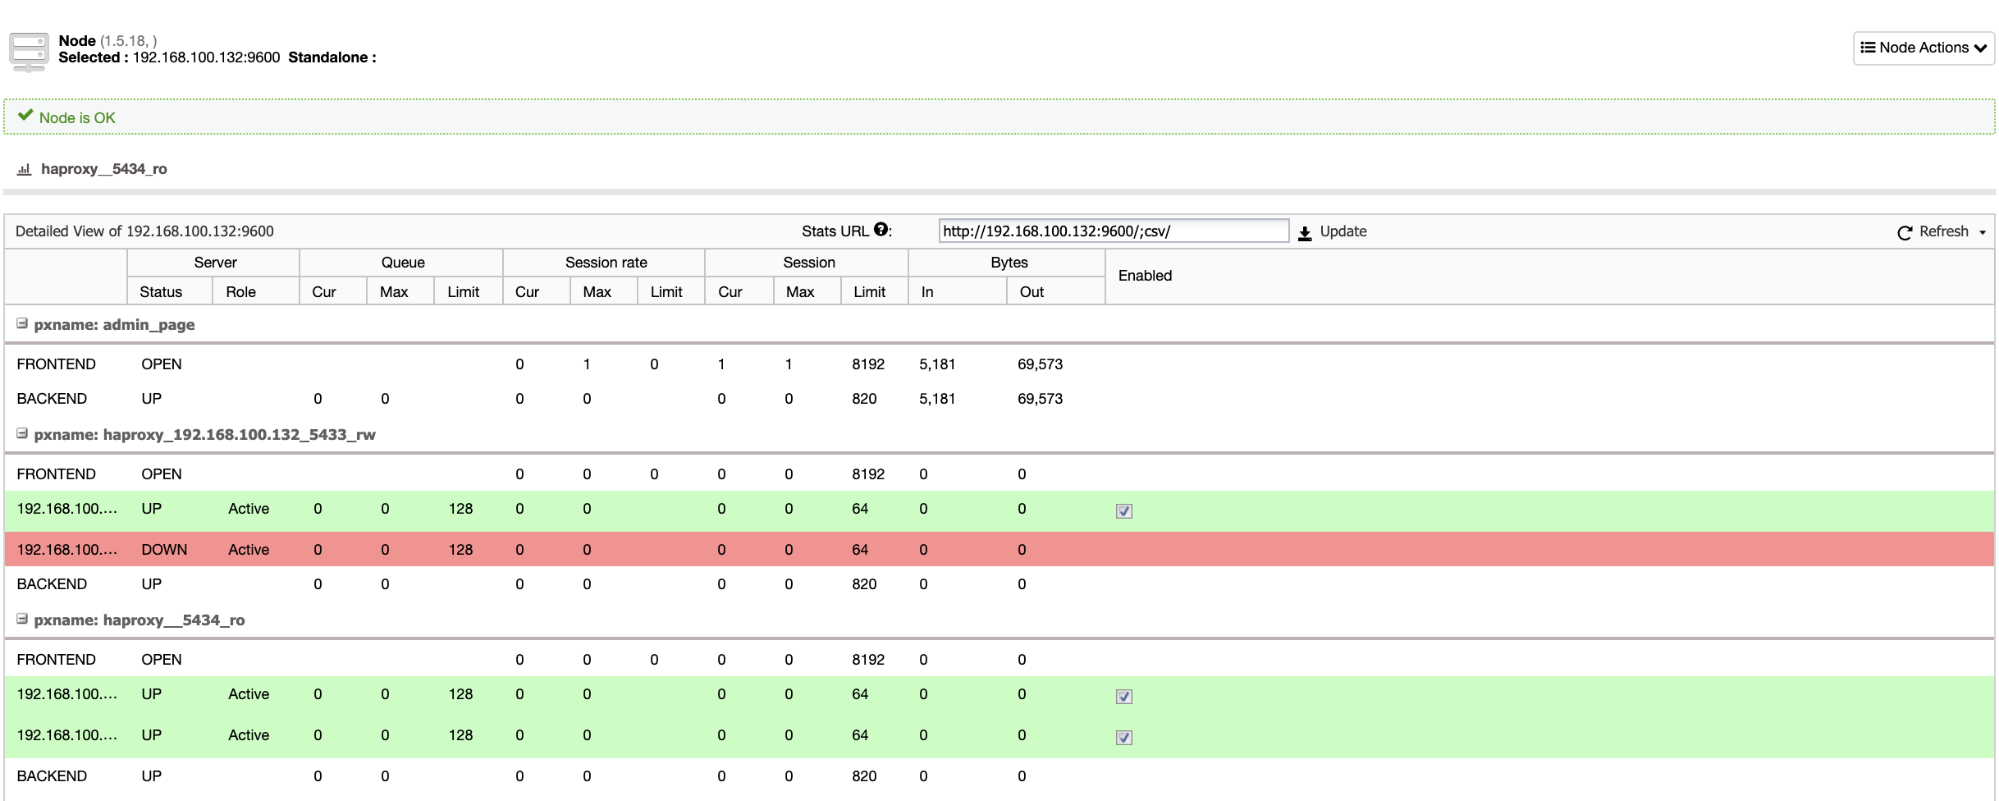
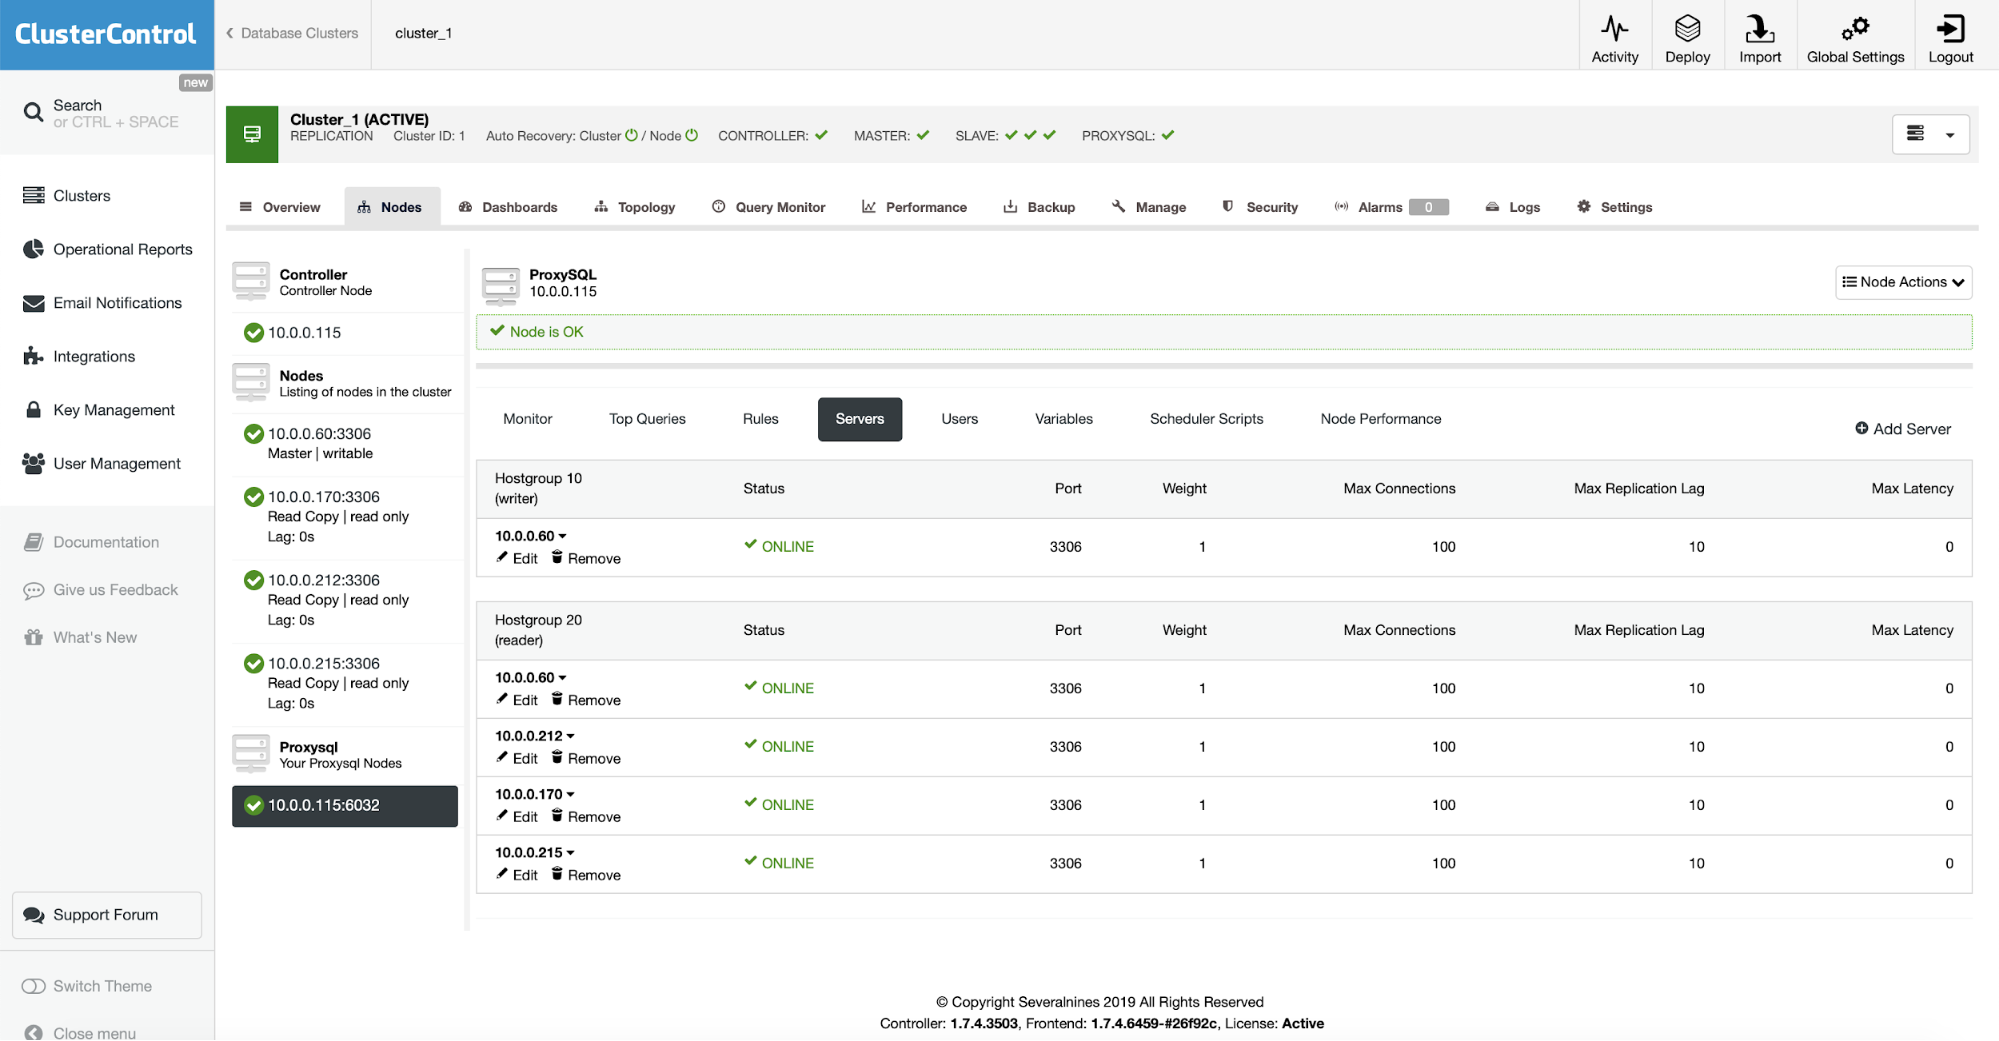
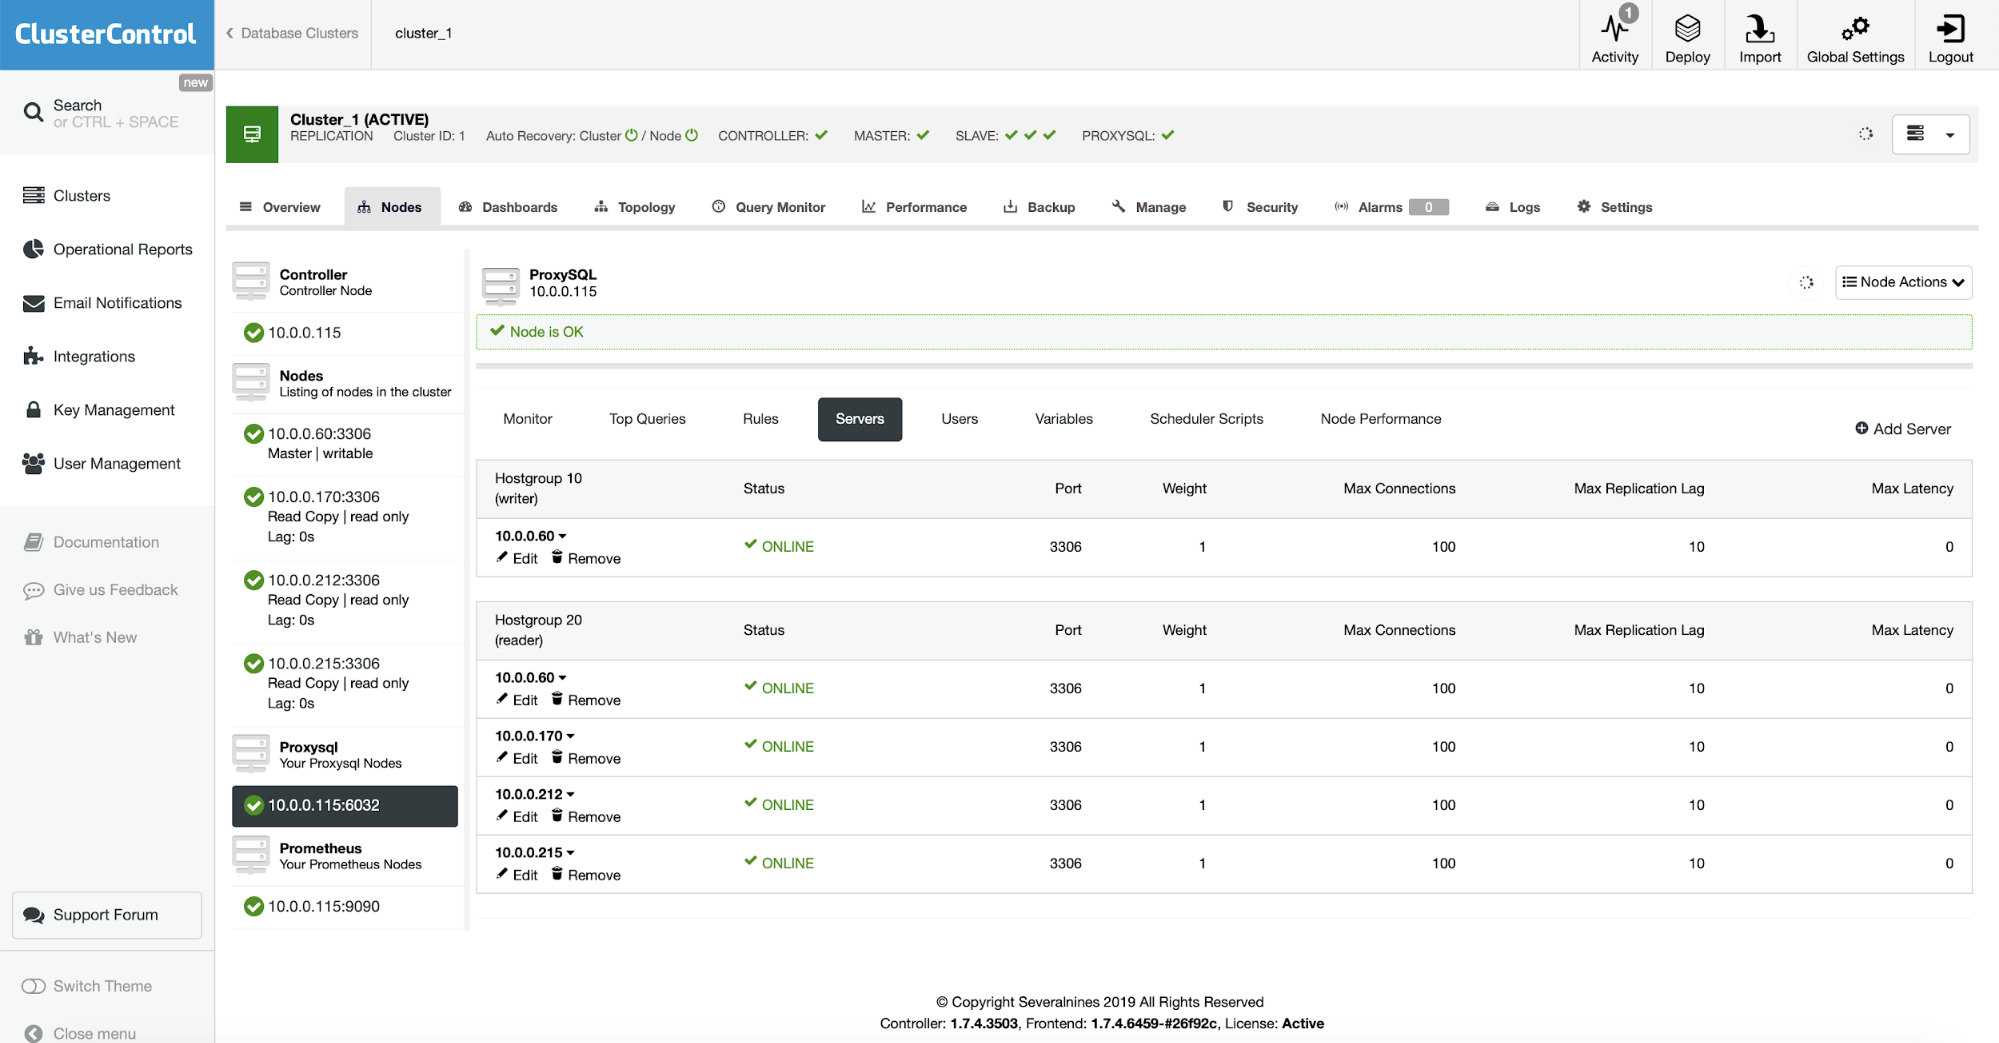
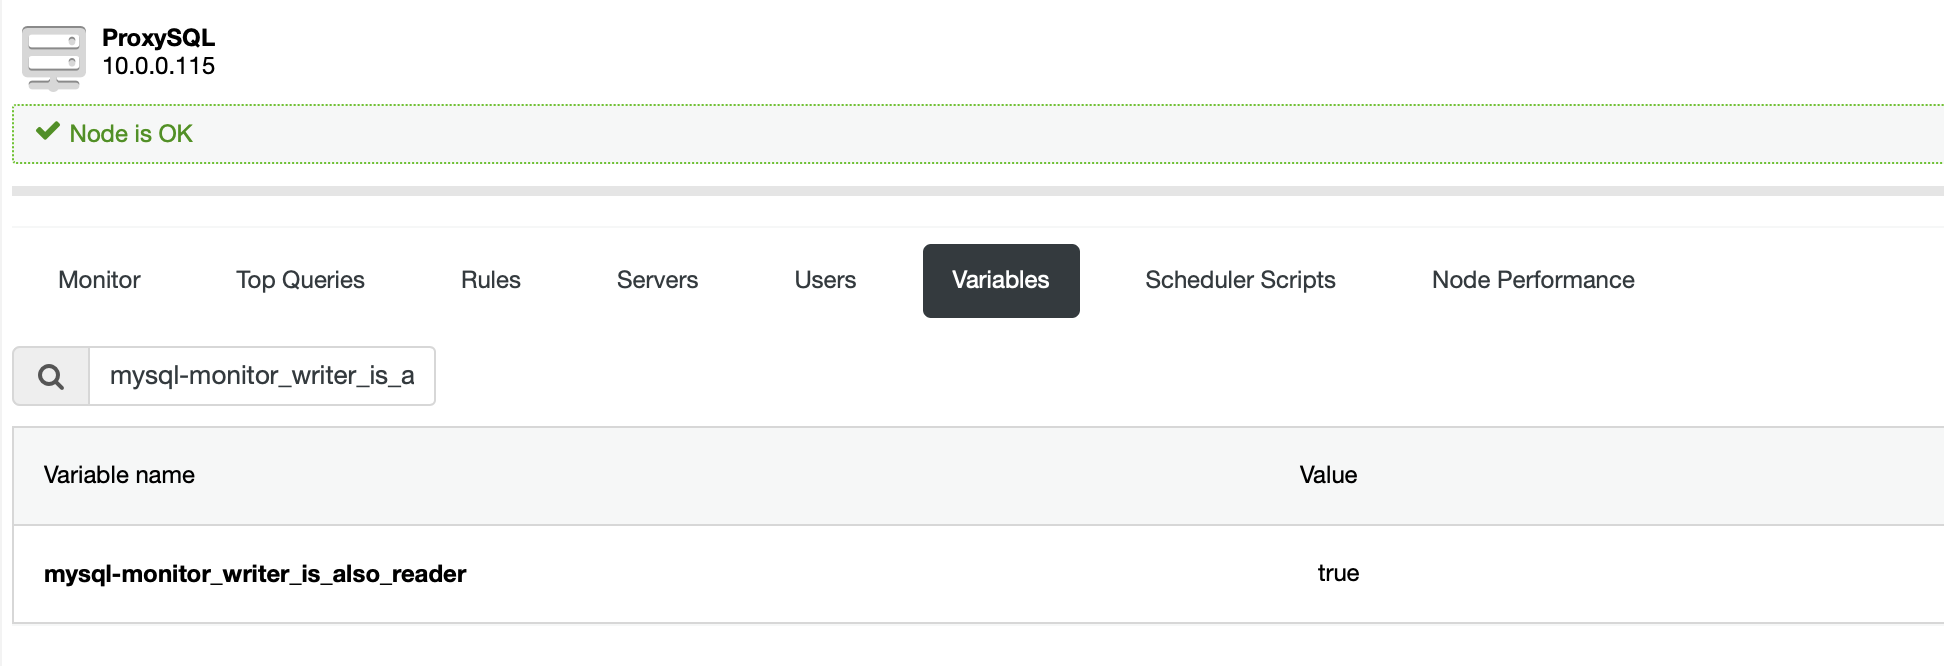
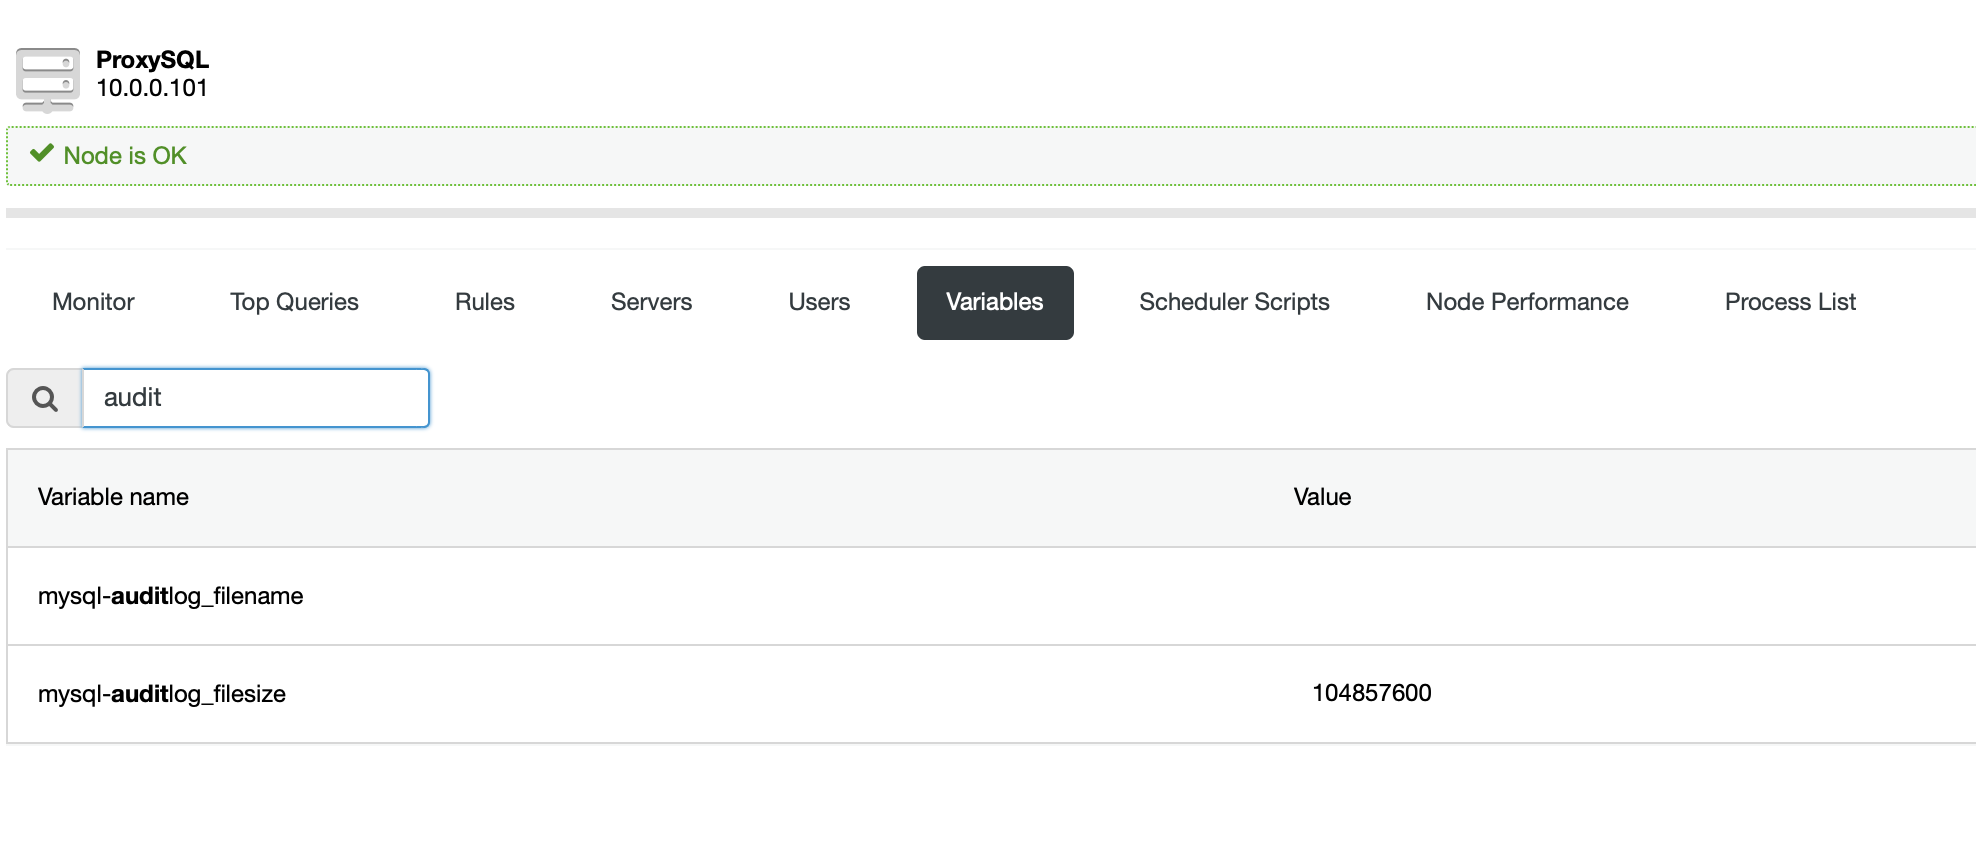
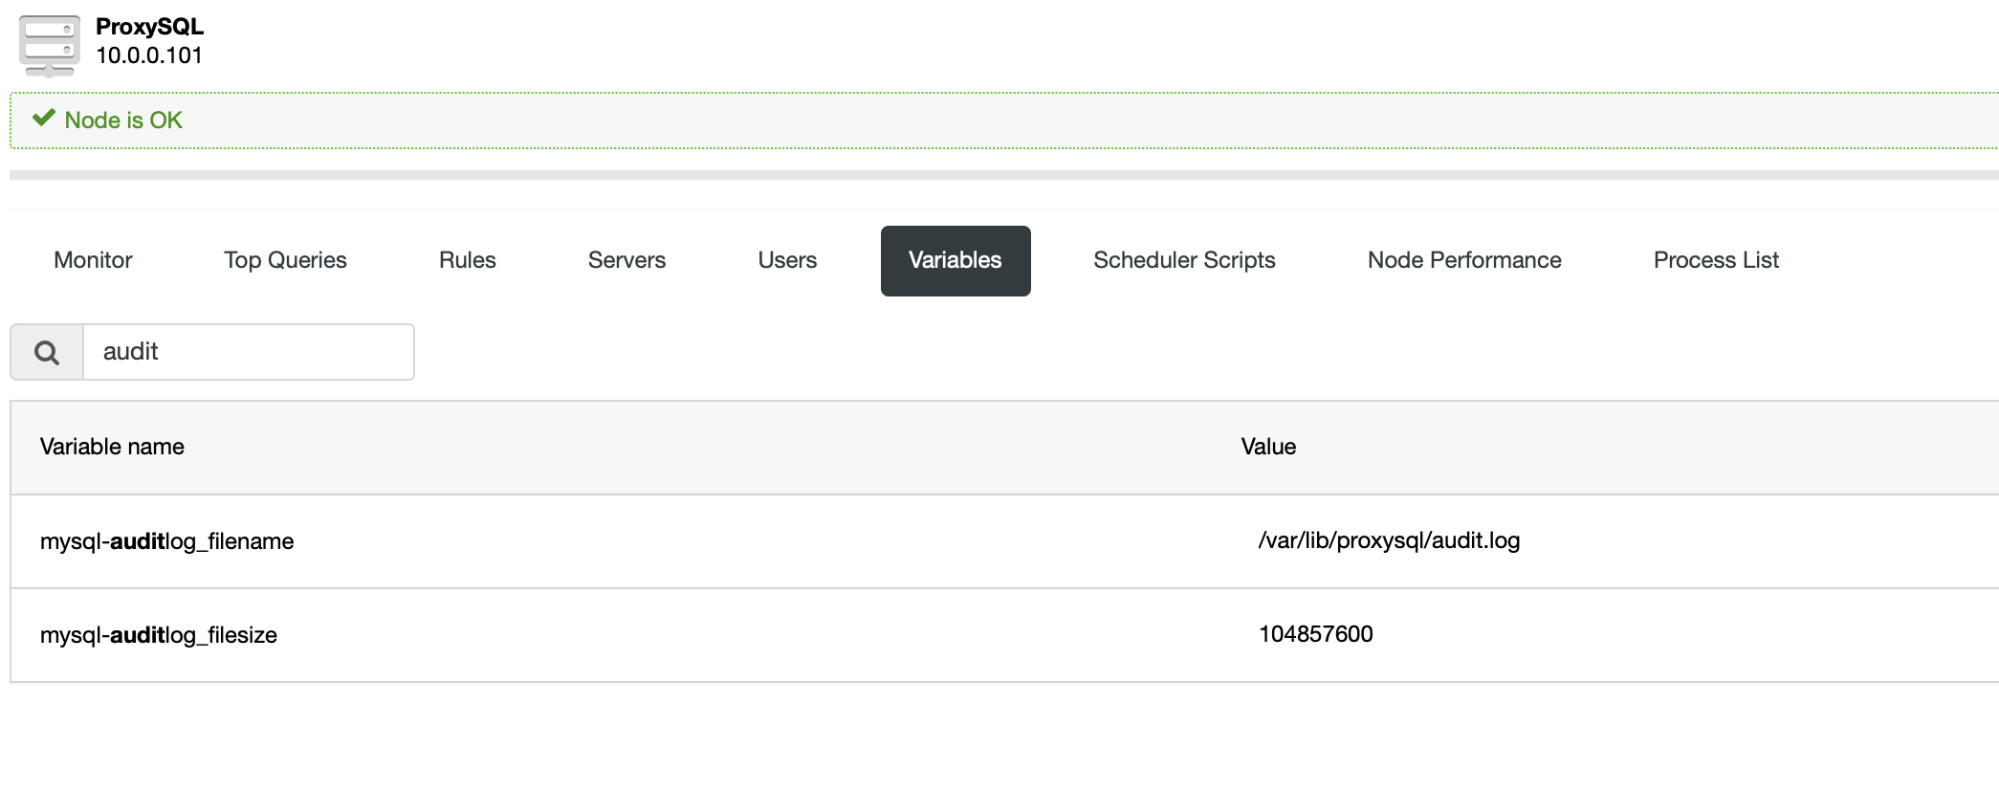
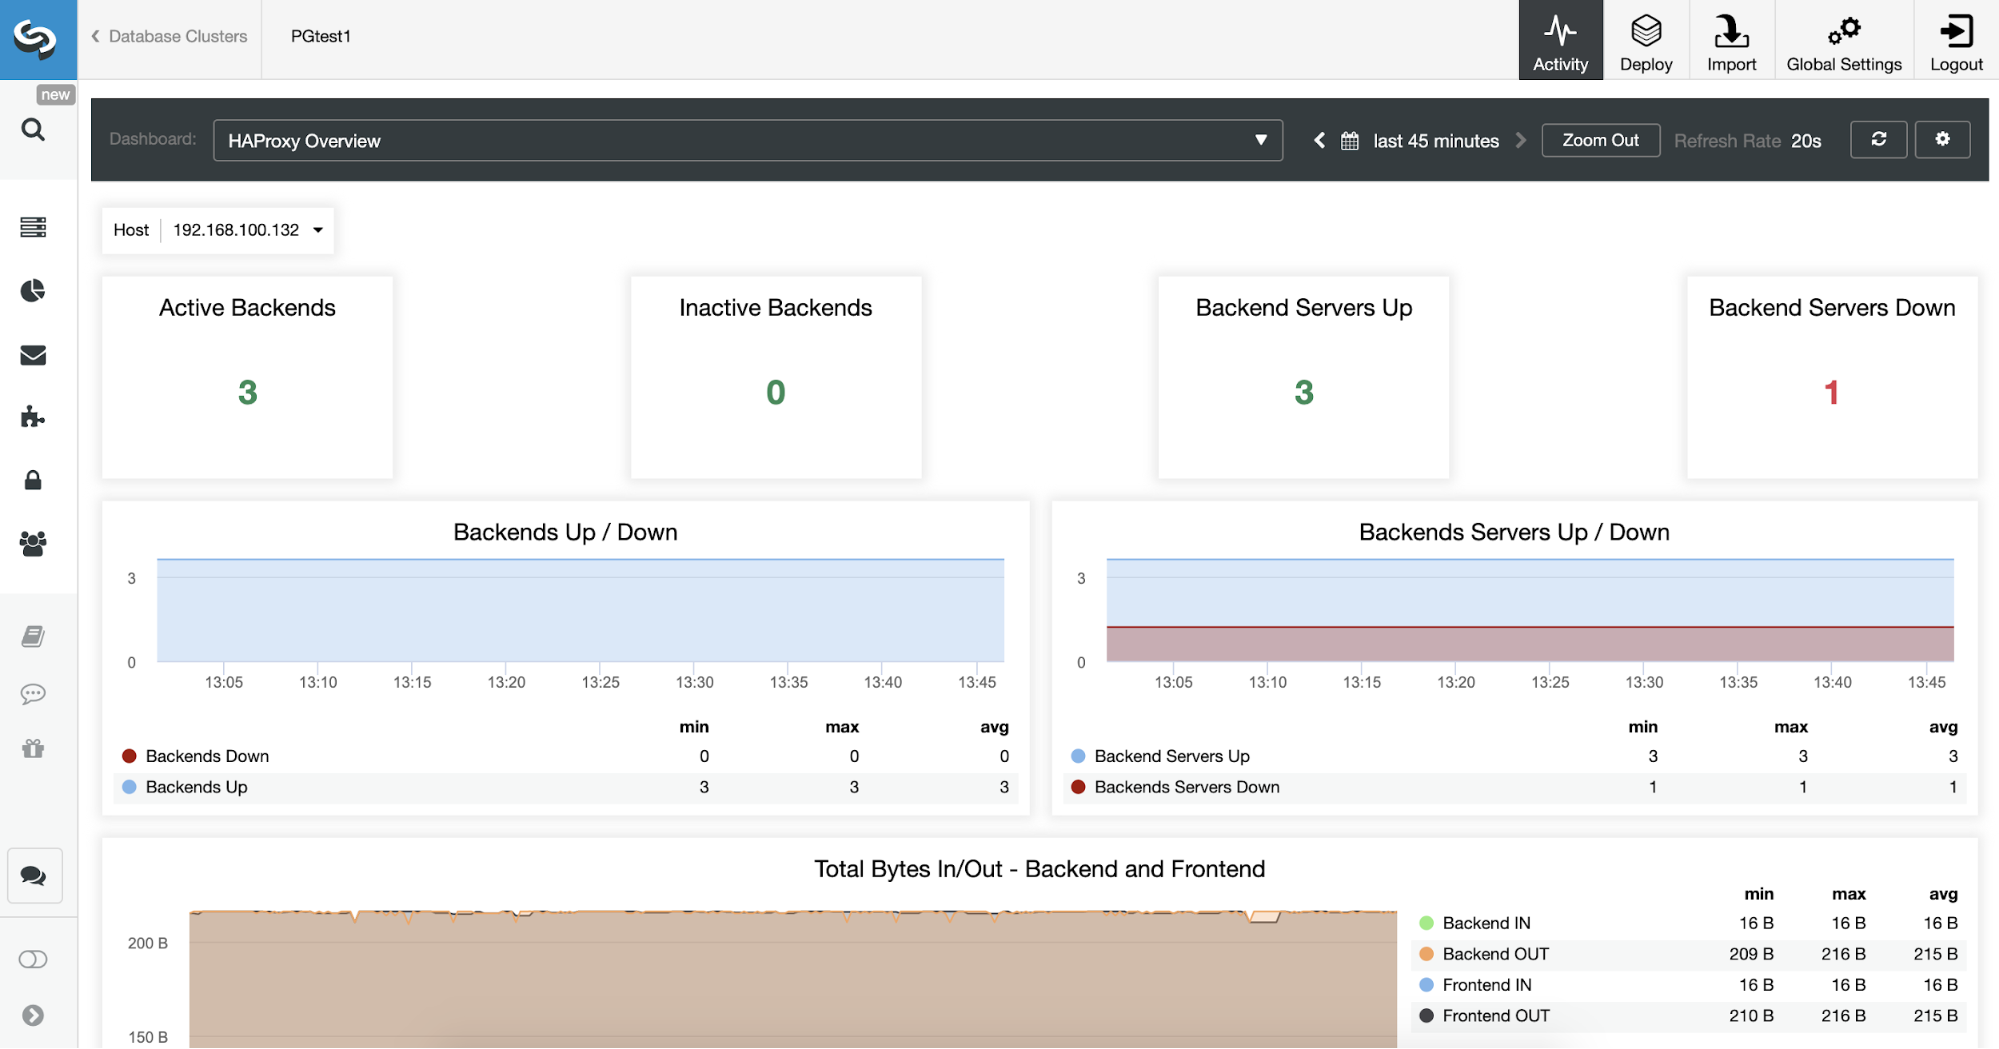
Finally, ProxySQL dashboard also shows that the traffic is distributed across all the nodes in the cluster:

ProxySQL Dashboard in ClusterControl

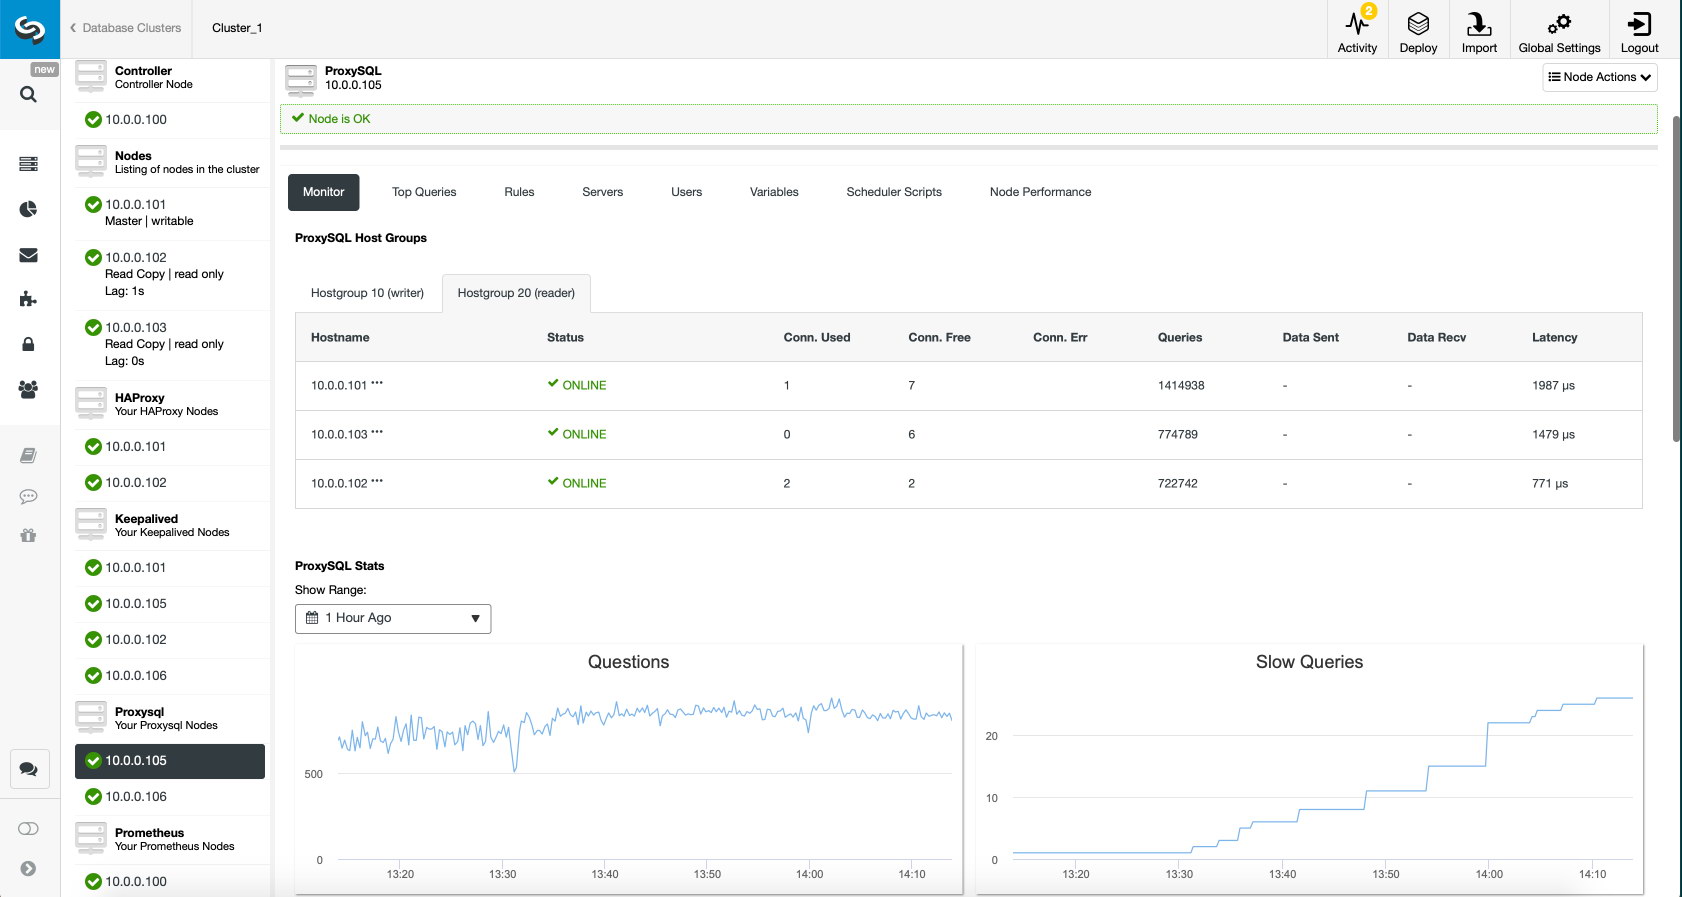
We hope you will benefit from this blog post, as you can see, with ClusterControl deploying the new architecture takes just a moment and requires just a handful of clicks to get things running. Let us know about your experience in such migrations.


MariaDB MaxScale Load Balancing on Docker: Management: Part Two

$
0
0

This blog post is a continuation of MariaDB MaxScale Load Balancing  on Docker: Deployment - Part1. In this part, we are going to focus more on management operations with advanced use cases like service control, configuration management, query processing, security and cluster reconciliation. The example steps and instructions shown in this post are based on the running environments that we have set up in the first part of this blog series.

Service Control

For MaxScale, starting and stopping the container is the only way to control the service. Provided the container has been created, we can use the following command to manage the service:

$ docker start maxscale
$ docker stop maxscale
$ docker restart maxscale

Running without Root Privileges

The Docker containers by default run with the root privilege and so does the application that runs inside the container. This is another major concern from the security perspective because hackers can gain root access to the Docker host by hacking the application running inside the container.

To run Docker as a non-root user, you have to add your user to the docker group. Firstly, create a docker group if there isn’t one:

$ sudo groupadd docker

Then, add your user to the docker group. In this example our user is "vagrant":

$ sudo usermod -aG docker vagrant

Log out and log back in so that your group membership is re-evaluated (or reboot if it does not work). At this point, you can run the MaxScale container with the standard run command (no sudo required) as user "vagrant":

$ docker run -d \
--name maxscale-unprivileged \
-p 4006:4006 \
-p 4008:4008 \
-p 8989:8989 \
-v $PWD/maxscale.cnf:/etc/maxscale.cnf \
mariadb/maxscale

MaxScale process runs by user "maxscale" and requires no special privileges up to the root level. Thus, running the container in non-privileged mode is always the best way if you are concerned about the security.

Configuration Management

For standalone MaxScale container, configuration management requires modification to the mapped configuration file followed by restarting the MaxScale container. However, if you are running as a Docker Swarm service, the new configuration has to be loaded into the Swarm Configs as a new version, for example:

$ cat maxscale.cnf | docker config create maxscale_config_v2 -

Then, update the service by removing the old configs (maxscale_config) and add the new one (maxscale_config_v2) to the same target:

$ docker service update \
--config-rm maxscale_config \
--config-add source=maxscale_config_v2,target=/etc/maxscale.cnf \
maxscale-cluster

Docker Swarm will then schedule container removal and replace procedures one container at a time until the replicas requirement is satisfied.

Upgrade and Downgrade

One of the advantages of running your applications in Docker is trivial upgrade and downgrade procedure. Every running container is based on an image, and this image can be switched easily with the image tag. To get the list of available images for MaxScale, check out the Tags section in the Docker Hub. The following examples show the process to downgrade a MaxScale 2.3 to one minor version earlier, 2.2:

$ docker run -d \
--name maxscale \
-p 4006:4006 \
-p 4008:4008 \
-v $PWD/maxscale.cnf:/etc/maxscale.cnf \
mariadb/maxscale:2.3
$ docker rm -f maxscale
$ docker run -d \
--name maxscale \
-p 4006:4006 \
-p 4008:4008 \
-v $PWD/maxscale.cnf:/etc/maxscale.cnf \
mariadb/maxscale:2.2

Make sure the configuration options are compatible with the version that you want to run. For example, the above downgrade would be failed at the first run due to the following errors:

2019-06-19 05:29:04.301   error  : (check_config_objects): Unexpected parameter 'master_reconnection' for object 'rw-service' of type 'service', or 'true' is an invalid value for parameter 'master_reconnection'.
2019-06-19 05:29:04.301   error  : (check_config_objects): Unexpected parameter 'delayed_retry' for object 'rw-service' of type 'service', or 'true' is an invalid value for parameter 'delayed_retry'.
2019-06-19 05:29:04.301   error  : (check_config_objects): Unexpected parameter 'transaction_replay_max_size' for object 'rw-service' of type 'service', or '1Mi' is an invalid value for parameter 'transaction_replay_max_size'.
2019-06-19 05:29:04.302   error  : (check_config_objects): Unexpected parameter 'transaction_replay' for object 'rw-service' of type 'service', or 'true' is an invalid value for parameter 'transaction_replay'.
2019-06-19 05:29:04.302   error  : (check_config_objects): Unexpected parameter 'causal_reads_timeout' for object 'rw-service' of type 'service', or '10' is an invalid value for parameter 'causal_reads_timeout'.
2019-06-19 05:29:04.302   error  : (check_config_objects): Unexpected parameter 'causal_reads' for object 'rw-service' of type 'service', or 'true' is an invalid value for parameter 'causal_reads'.

What we need to do is to remove the unsupported configuration options as shown above in the configuration file before downgrading the container image:

  • master_reconnection
  • delayed_retry
  • transaction_replay
  • causal_reads_timeout
  • causal_reads

Finally, start the container again and you should be good. Version upgrade for MaxScale works similarly. Just change the tag that you want to use and off you go.

MaxScale Filters

MaxScale uses a component called filter to manipulate or process the requests as they pass through it. There are a bunch of filters you can use, as listed in this page, MaxScale 2.3 Filters. For example, a specific query can be logged into a file if it matches a criteria or you can rewrite the incoming query before it reaches the backend servers.

To activate a filter, you have to define a section and include the definition name into the corresponding service definition, as shown in the examples further down.

Query Logging All (QLA)

As its name explains, QLA filter logs all queries match the set of rule per client session. All queries will be logged following the filebase format.

Firstly, define the component with type=filter and module=qlafilter:

## Query Log All (QLA) filter
## Filter module for MaxScale to log all query content on a per client session basis
[qla-sbtest-no-pk]
type		= filter
module		= qlafilter
filebase	= /tmp/sbtest
match		= select.*from.*
exclude		= where.*id.*
user		= sbtest

Then add the filter component into our services:

[rw-service]
...
filters        = qla-sbtest-no-pk
[rr-service]
...
filters        = qla-sbtest-no-pk

It's also a good idea to map /tmp of the container with the actual directory on the Docker host, so we don't have to access the container to retrieve the generated log files. Firstly, create a directory and give global writable permission:

$ mkdir qla
$ chmod 777 qla

Since we need to bind the above directory into the container, we have to stop and remove the running container and re-run it with the following command:

$ docker stop maxscale
$ docker run -d \
--name maxscale \
--restart always \
-p 4006:4006 \
-p 4008:4008 \
-p 8989:8989 \
-v $PWD/maxscale.cnf:/etc/maxscale.cnf \
-v $PWD/qla:/tmp \
mariadb/maxscale

You can then retrieve the content of the logged queries inside the qla directory:

$ cat qla/*
Date,User@Host,Query
2019-06-18 08:25:13,sbtest@::ffff:192.168.0.19,select * from sbtest.sbtest1

Query Rewriting

Query rewrite is a feature that, depending on the queries running against the database server, quickly allows to isolate and correct problematic queries and improve performance.

Query rewriting can be done via regexfilter. This filter can match or exclude incoming statements using regular expressions and replace them with another statement. Every rule is defined in its own section and include the section name in the corresponding service to activate it.

The following filter will match a number of SHOW commands that we don't want to expose to the read-only clients:

## Rewrite query based on regex match and replace
[block-show-commands]
type            = filter
module          = regexfilter
options         = ignorecase
match           = ^show (variables|global variables|global status|status|processlist|full processlist).*
replace         = SELECT 'Not allowed'

Then we can append the filter to the service that we want to apply. For example, all read-only connections have to be filtered for the above:

[rr-service]
...
filters        = qla-sbtest-no-pk | block-show-commands

Keep in mind that multiple filters can be defined using a syntax akin to the Linux shell pipe "|" syntax. Restart the container to apply the configuration changes:

$ docker restart maxscale

We can then verify with the following query:

$ mysql -usbtest -p -h192.168.0.200 -P4006 -e 'SHOW VARIABLES LIKE "max_connections"'
+-------------+
| Not allowed |
+-------------+
| Not allowed |
+-------------+

You will get the result as expected.

Cluster Recovery

MaxScale 2.2.2 and later supports automatic or manual MariaDB replication or cluster recovery for the following events:

  • failover
  • switchover
  • rejoin
  • reset-replication

Failover for the master-slave cluster can and often should be set to activate automatically. Switchover must be activated manually through MaxAdmin, MaxCtrl or the REST interface. Rejoin can be set to automatic or activated manually. These features are implemented in the "mariadbmon" module.

The following automatic failover events happened if we purposely shutdown the active master, 192.168.0.91:

$ docker logs -f maxscale
...
2019-06-19 03:53:02.348   error  : (mon_log_connect_error): Monitor was unable to connect to server mariadb1[192.168.0.91:3306] : 'Can't connect to MySQL server on '192.168.0.91' (115)'
2019-06-19 03:53:02.351   notice : (mon_log_state_change): Server changed state: mariadb1[192.168.0.91:3306]: master_down. [Master, Running] -> [Down]
2019-06-19 03:53:02.351   warning: (handle_auto_failover): Master has failed. If master status does not change in 4 monitor passes, failover begins.
2019-06-19 03:53:16.710   notice : (select_promotion_target): Selecting a server to promote and replace 'mariadb1'. Candidates are: 'mariadb2', 'mariadb3'.
2019-06-19 03:53:16.710   warning: (warn_replication_settings): Slave 'mariadb2' has gtid_strict_mode disabled. Enabling this setting is recommended. For more information, see https://mariadb.com/kb/en/library/gtid/#gtid_strict_mode
2019-06-19 03:53:16.711   warning: (warn_replication_settings): Slave 'mariadb3' has gtid_strict_mode disabled. Enabling this setting is recommended. For more information, see https://mariadb.com/kb/en/library/gtid/#gtid_strict_mode
2019-06-19 03:53:16.711   notice : (select_promotion_target): Selected 'mariadb2'.
2019-06-19 03:53:16.711   notice : (handle_auto_failover): Performing automatic failover to replace failed master 'mariadb1'.
2019-06-19 03:53:16.723   notice : (redirect_slaves_ex): Redirecting 'mariadb3' to replicate from 'mariadb2' instead of 'mariadb1'.
2019-06-19 03:53:16.742   notice : (redirect_slaves_ex): All redirects successful.
2019-06-19 03:53:17.249   notice : (wait_cluster_stabilization): All redirected slaves successfully started replication from 'mariadb2'.
2019-06-19 03:53:17.249   notice : (handle_auto_failover): Failover 'mariadb1' -> 'mariadb2' performed.
2019-06-19 03:53:20.363   notice : (mon_log_state_change): Server changed state: mariadb2[192.168.0.92:3306]: new_master. [Slave, Running] -> [Master, Running]

After failover completes, our topology is now looking like this:

For switchover operation, it requires human intervention and one way to do it through MaxCtrl console. Let's say the old master is back operational and is ready to be promoted as a master, we can perform the switchover operation by sending the following command:

$ docker exec -it maxscale maxctrl
maxctrl: call command mariadbmon switchover monitor mariadb1 mariadb2
OK

Where, the formatting is:

$ call command <monitoring module> <operation> <monitoring section name> <new master> <current master>

Then, verify the new topology by listing out the servers:

 maxctrl: list servers
┌──────────┬──────────────┬──────┬─────────────┬─────────────────┬──────────────┐
│ Server   │ Address      │ Port │ Connections │ State           │ GTID         │
├──────────┼──────────────┼──────┼─────────────┼─────────────────┼──────────────┤
│ mariadb1 │ 192.168.0.91 │ 3306 │ 0           │ Master, Running │ 0-5001-12144 │
├──────────┼──────────────┼──────┼─────────────┼─────────────────┼──────────────┤
│ mariadb2 │ 192.168.0.92 │ 3306 │ 0           │ Slave, Running  │ 0-5001-12144 │
├──────────┼──────────────┼──────┼─────────────┼─────────────────┼──────────────┤
│ mariadb3 │ 192.168.0.93 │ 3306 │ 0           │ Slave, Running  │ 0-5001-12144 │
└──────────┴──────────────┴──────┴─────────────┴─────────────────┴──────────────┘

We just promoted our old master back to its original spot. Fun fact, ClusterControl automatic recovery feature does exactly the same thing if it is enabled.

Final Thoughts

Running MariaDB MaxScale on Docker brings additional benefits like MaxScale clustering, easy to upgrade and downgrade, and also advanced proxying functionalities for MySQL and MariaDB clusters.

How to Manage MariaDB 10.3 with ClusterControl

$
0
0

MariaDB Server is no longer a straight imitate of MySQL. It grew into a mature fork, which implements new functionalities similar to what proprietary database systems offer in the upstream. MariaDB 10.3 greatly extends the list of enterprise features, and with new SQL_MODE=Oracle becomes an exciting choice for companies that would like to migrate their Oracle databases to an open source database. However, operational management is an area where there is still some catching up to do, and MariaDB requires that you build your own scripts.

Perhaps a good opportunity to look into an automation system?

Automated procedures are accurate and consistent. They can give you much-needed repeatability so you can minimize the risk of change in the production systems. However, as modern open source databases develop so fast, it's more challenging to keep your management systems on par with all new features.

The natural next step is to look for automation platforms. There are many platforms that you can use to deploy systems. Puppet, Chef, and Ansible are probably the best examples of that new trend. These platforms are suitable for the fast deployment of various software services. They are perfect for deployments, but still require you to maintain the code, cover feature changes, and usually, they cover just one aspect of your work. Things like backups, performance, and maintenance still need external tools or scripts.

On the other side, we have cloud platforms, with polished interfaces and a variety of additional services for a fully managed experience. However, it may not be feasible; for instance, hybrid environments where you might be using the cloud, but with still a significant on-prem footprint.

So, how about a dedicated management layer for your MariaDB databases?

ClusterControl was designed to automate the deployment and management of MariaDB as well as other open-source databases. At the core of ClusterControl is functionality that lets you automate the database tasks you have to perform regularly, like deploying new database instances and clusters, managing backups, high availability and failover, topology changes, upgrades, scaling new nodes and more.

ClusterControl installation

To start with ClusterControl, you need a dedicated virtual machine or host. The VM and supported systems requirements are described here. At the minimum you can start from tiny VM 2 GB RAM, 2 CPU cores and 20 GB storage space, either on-prem or in the cloud.

The primary installation method is to download an installation wizard that walks you through all the steps (OS configuration, package download and installation, metadata creation, and others).

For environments without internet access, you can use the offline installation process.

ClusterControl is agentless so you don't need to install additional software. It requires only SSH access to the database hosts. It also supports agent-based monitoring for higher resolution monitoring data.

To set up passwordless SSH to all target nodes (ClusterControl and all database hosts), run the following commands on the ClusterControl server:

$ ssh-keygen -t rsa # press enter on all prompts
$ ssh-copy-id -i ~/.ssh/id_rsa [ClusterControl IP address]
$ ssh-copy-id -i ~/.ssh/id_rsa [Database nodes IP address] # repeat this to all target database nodes

One of the most convenient ways to try out cluster control maybe the option to run it in docker container.

docker run -d --name clustercontrol \
--network db-cluster \
--ip 192.168.10.10 \
-h clustercontrol \
-p 5000:80 \
-p 5001:443 \
-v /storage/clustercontrol/cmon.d:/etc/cmon.d \
-v /storage/clustercontrol/datadir:/var/lib/mysql \
-v /storage/clustercontrol/sshkey:/root/.ssh \
-v /storage/clustercontrol/cmonlib:/var/lib/cmon \
-v /storage/clustercontrol/backups:/root/backups \
severalnines/clustercontrol

After successful deployment, you should be able to access the ClusterControl Web UI at {host's IP address}:{host's port}, for example:

HTTP: http://192.168.10.100:5000/clustercontrol
HTTPS: https://192.168.10.100:5001/clustercontrol

Installation of MariaDB Cluster

Once we enter the ClusterControl interface, the first thing to do is to deploy a new database or import an existing one. The version 1.7.2 introduced support for version 10.3 (along with 10.0,10.1,10.2). In 1.7.3 which was released this week, we can see the improved deployment of installation in the cloud.

ClusterControl: Deploy/Import

At the time of writing this blog, the current versions are 10.3.16. Latest packages are picked up by default. Select the option "Deploy Database Cluster" and follow the instructions that appear.

Now is the time to provide data needed for the connection between ClusterControl and DB nodes. At this step, you would have clean VM's or images of OS that you use inside your organization. When choosing MariaDB, we must specify User, Key or Password and port to connect by SSH to our servers.

ClusterControl: Deploy Database Cluster

After setting up the SSH access information, we must enter the data to access our database, for MariaDB that will be the superuser root. We can also specify which repository to use. You can have three types of repositories when deploying database server/cluster using ClusterControl:

  • Use Vendor Repository. Provision software by setting up and using the database vendor's preferred software repository. ClusterControl will install the latest version of what is provided by the database vendor repository.
  • Do Not Setup Vendor Repositories. No repositories will be set up by ClusterControl. ClusterControl will rely on the system configuration (your default repository files).
  • Create and mirror the current database vendor's repository and then deploy using the local mirrored repository. This allows you to "freeze" the current versions of the software packages.

When all is set, hit the deploy button. The deployment process will also take care of the installation of additional tools provided by MariaDB like mariabackup and tools from external vendors, popular in database administration.

Import a New Cluster

We also have the option to manage an existing setup by importing it into ClusterControl. Such an environment can be created by ClusterControl or other methods (puppet, chef, ansible, docker …). The process is simple and doesn't require specialized knowledge.

First, we must enter the SSH access credentials to our existing database servers. Then we enter the access credentials to our database, the server data directory, and the version. We add the nodes by IP or hostname, in the same way as when we deploy, and press on Import. Once the task is finished, we are ready to manage our cluster from ClusterControl. At this point, we can also define the options for the node or cluster auto recovery.

ClusterControl: Import existing 10.3 database cluster

Scaling MariaDB, Adding More Nodes to DB Cluster

With ClusterControl, adding more servers to the server is an easy step. You can do that from the GUI or CLI. For more advanced users, you can use ClusterControl Developer Studio and write a resource base condition to expand your cluster automatically.

ClusterControl: Adding MariaDB Node

ClusterControl supports an option to use an existing backup, so there is no need to overwhelm the production master node with additional work.

Securing MariaDB

The default MariaDB installation comes with relaxed security. This has been improved with the recent versions however production-grade systems still require tweaks in the default my.cnf configuration. ClusterControl deployments come with non-default my.cnf settings (different for different cluster types).

ClusterControl removes human error and provides access to a suite of security features, to automatically protect your databases from hacks and other threats.

ClusterControl: Security Panel

ClusterControl enables SSL support for MariaDB connections. Enabling SSL adds another level of security for communication between the applications (including ClusterControl) and database. MariaDB clients open encrypted connections to the database servers and verify the identity of those servers before transferring any sensitive information.

ClusterControl will execute all necessary steps, including creating certificates on all database nodes. Such certificates can be maintained later on in the Key Management tab.

With ClusterControl you can also enable auditing. It uses the audit plugin provided by MariaDB. Continuous auditing is an imperative task for monitoring your database environment. By auditing your database, you can achieve accountability for actions taken or content accessed. Moreover, the audit may include some critical system components, such as the ones associated with financial data to support a precise set of regulations like SOX, or the EU GDPR regulation. The guided process lets you choose what should be audited and how to maintain the audit log files.

Monitoring and Alerting

When working with database systems, you should be able to monitor them. That will enable you to identify trends, plan for upgrades or improvements or react effectively to any problems or errors that may arise.

ClusterControl: Overview

The new ClusterControl is using Prometheus as the data store with PromQL query language. The list of dashboards includes Server General, Server Caches, InnoDB Metrics, Replication Master, Replication Slave, System Overview, and Cluster Overview Dashboards.

ClusterControl: DashBoard

ClusterControl installs Prometheus agents, configures metrics and maintains access to Prometheus exporters configuration via its GUI, so you can better manage parameter configuration like collector flags for the exporters (Prometheus).

As a database operator, we need to be informed whenever something critical occurs in our database. The three main methods in ClusterControl to get an alert includes:

  • email notifications
  • integrations
  • advisors
ClusterControl: Integration Services

You can set the email notifications on a user level. Go to Settings > Email Notifications. Where you can choose between criticality and type of alert to be sent.

The next method is to use the Integration services. This is to pass the specific category of events to the other service like ServiceNow tickets, Slack, PagerDuty, etc. so you can create advanced notification methods and integrations within your organization.

The last one is to involve sophisticated metrics analysis in the Advisor section, where you can build intelligent checks and triggers.

ClusterControl: Advisors

SQL Monitoring

The SQL Monitoring is divided into three sections.

  • Top Queries - presents the information about queries that take a significant chunk of resources.
    Query Monitor: Top queries
    Query Monitor: Top queries
  • Running Queries - it’s a process list of information combined from all database cluster nodes into one view. You can use that to kill queries that affect your database operations.
    Query Monitor: Running Queries
    Query Monitor: Running Queries
  • Query Outliers - present the list of queries with execution time longer than average.
    Query Monitor: Query Outliers
    Query Monitor: Query Outliers

Backup and Recovery

Now that you have your MariaDB up and running, and have your monitoring in place, it is time for the next step: ensure you have a backup of your data.

ClusterControl: Backup repository

ClusterControl provides an interface for MariaDB backup management with support for scheduling and creative reports. It gives you two options for backup methods.

  • Logical backup (text): mysqldump
  • Binary backups: xtrabackup (lower versions), mariabackup

A good backup strategy is a critical part of any database management system. ClusterControl offers many options for backups and recovery/restore.

ClusterControl backup retention is configurable; you can choose to retain your backup for any time period or to never delete backups. AES256 encryption is employed to secure your backups against rogue elements. For rapid recovery, backups can be restored directly into a new cluster - ClusterControl handles the full restore process from the launch of a new database setup to the recovery of data, removing error-prone manual steps from the process.

Backups can be automatically verified upon completion, and then uploaded to cloud storage services (AWS, Azure and Google). Different retention policies can be defined for local backups in the data center as well as backups that are uploaded in the cloud.

Node and cluster auto-recovery

ClusterControl provides advanced support for failure detection and handling. It also allows you to deploy different proxies to integrate them with your HA stack, so there is no need to adjust application connection string or DNS entry to redirect the application to the new master node.

When the master server is down, ClusterControl will create a job to perform automatic failover. ClusterControl does all the background work to elect a new master, deploy failover slave servers, and configure load balancers.

ClusterControl automatic failover was designed with the following principles:

  • Make sure the master is really dead before you failover
  • Failover only once
  • Do not failover to an inconsistent slave
  • Only write to the master
  • Do not automatically recover the failed master

With the built-in algorithms, failover can often be performed pretty quickly so you can assure the highest SLA's for your database environment.

ClusterControl: Auto Recovery

The process is highly configurable. It comes with multiple parameters that you can use to adopt recovery to the specifics of your environment. Among the different options you can find replication_stop_on_error, replication_auto_rebuild_slave, replication_failover_blacklist, replication_failover_whitelist, replication_skip_apply_missing_txs, replication_onfail_failover_script and many others.

Failover is the process of moving to a healthy standby component, during a failure or maintenance event, in order to preserve uptime. The quicker it can be done, the faster you can be back online. If you're looking at minimizing downtime and meet your SLAs through an automated approach for TimescaleDB, then this blog is for you.

MaxScale Load Balancer

In addition to MariaDB 10.3, ClusterControl adds an option of MaxScale 2.3 load balancer. MaxScale is a SQL-aware proxy that can be used to build highly available environments. It comes with numerous features, however, the main goal is to enable load balancing and high availability.

ClusterControl: MaxScale

MaxScale can be used to track the health of the master MariaDB node and, should it fail, perform a fast, automatic failover. Automated failover is crucial in building up a highly available solution that can recover promptly from the failure.

Load Balance Database Sessions

Read-write splitting is a critical feature to allow read scaling. It is enough for the application to connect to the MaxScale, and it detects the topology, determine which MariaDB acts as a master and which act as slaves. It routes the traffic accordingly to this.

Summary

We hope that this blog helps you to get familiar with ClusterControl and MariaDB 10.3 administration modules. The best option is to download ClusterControl and test each of them.

Database Load Balancing Using HAProxy on Amazon AWS

$
0
0

When traffic to your database increases day-after-day it can start to become hard to manage. When this situation happens it’s useful to distribute the traffic across multiple servers, thus improving performance. Depending on the application, however, this may not be possible (if you have a single configurable endpoint).  To achieve a split, you will need to use a load balancer to perform the task. 

A load balancer can redirect applications to available/healthy database nodes and then failover when required. To deploy it, you don’t need a physical server as you can deploy it in the cloud; making it easier and faster. In this blog, we’ll take a look at the popular database load balancer HAProxy and how to deploy it to Amazon AWS both manually and with ClusterControl’s help.

What is HAProxy?

HAProxy is an open source proxy that can be used to implement high availability, load balancing, and proxying for TCP and HTTP based applications.

As a load balancer, HAProxy distributes traffic from one origin to one or more destinations and can define specific rules and/or protocols for this task. If any of the destinations stops responding, it is marked as offline, and the traffic is sent to the rest of the available destinations.

An Overview of Amazon EC2

Amazon Elastic Compute Cloud (or EC2) is a web service that provides resizable compute capacity in the cloud. It gives you complete control of your computing resources and allows you to set up and configure everything within your instances from the operating system up to your applications. It also allows you to quickly scale capacity, both up and down, as your computing requirements change.

Amazon EC2 supports different operating systems like Amazon Linux, Ubuntu, Windows Server, Red Hat Enterprise Linux, SUSE Linux Enterprise Server, Fedora, Debian, CentOS, Gentoo Linux, Oracle Linux, and FreeBSD.

Now, let’s see how to create an EC2 instance to deploy HAProxy there.

Creating an Amazon EC2 Instance

For this example, we’ll assume that you have an Amazon AWS account.

Go to the Amazon EC2 section, and press on Launch Instance. In the first step, you must choose the EC2 instance operating system.

Create Amazon EC2 Instance

In the next step, you must choose the resources for the new instance.

Choose an Amazon EC2 Instance Type

Then, you can specify a more detailed configuration like network, subnet, and more.

Configure Amazon EC2 Instance

We can now add more storage capacity on this new instance, as this will be only a load balancer (it's probably not necessary).

Amazon EC2 Add Storage

When we finish the creation task, we can go to the Instances section to see our new EC2 instance.

Launch Amazon EC2 Instance

Now that our EC2 instance is ready (Instance State running), we can deploy our load balancer here. For this task, we’ll see two different ways, manually and using ClusterControl.

How Manually Install and Configure HAProxy

To install HAProxy on Linux you can use the following commands in our EC2 instance:

On Ubuntu/Debian OS:

$ apt-get install haproxy -y

On CentOS/RedHat OS:

$ yum install haproxy -y

And then we need to edit the following configuration file to manage our HAProxy configuration:

$ /etc/haproxy/haproxy.cfg

Configuring our HAProxy is not complicated, but we need to know what we are doing. We have several parameters to configure, depending on how we want HAProxy to work. For more information, we can follow the documentation about the HAProxy configuration.

Let's look at a basic configuration example. Suppose that you have the following database topology:

Basic Load Balancer Configuration

We want to create an HAProxy listener to balance the read traffic between the three nodes.

listen haproxy_read

   bind *:5434

   balance     roundrobin

   server  node1 10.1.1.10:5432 check

   server  node2 10.1.1.11:5432 check

   server  node3 10.1.1.12:5432 check

As we mentioned before, there are several parameters to configure here, and this configuration depends on what we want to do. For example:

listen  haproxy_read

       bind *:5434

       mode tcp

       timeout client  10800s

       timeout server  10800s

       tcp-check expect string is\ running

       balance leastconn

       option tcp-check

       default-server port 9201 inter 2s downinter 5s rise 3 fall 2 slowstart 60s maxconn 64 maxqueue 128 weight 100

       server  node1 10.1.1.10:5432 check

       server  node2 10.1.1.11:5432 check

       server  node3 10.1.1.12:5432 check

Now, let’s see how ClusterControl can make this task in an easy way.

How to Install and Configure HAProxy with ClusterControl

For this task, we’ll assume that you have ClusterControl installed (on-prem or in the cloud) and it’s currently managing your databases.

Go to ClusterControl -> Select Cluster -> Cluster Actions -> Add Load Balancer.

ClusterControl Cluster List

Here we must add the information that ClusterControl will use to install and configure our HAProxy load balancer.

Configure HAProxy in ClusterControl

The information that we need to introduce is:

Action: Deploy or Import.

Server Address: IP Address for our HAProxy server.

Listen Port (Read/Write): Port for read/write mode.

Listen Port (Read Only): Port for read only mode.

Policy: It can be:

  • leastconn: The server with the lowest number of connections receives the connection.
  • roundrobin: Each server is used in turns, according to their weights.
  • source: The source IP address is hashed and divided by the total weight of the running servers to designate which server will receive the request.

Install for read/write splitting: For master-slave replication.

Build from Source: We can choose Install from a package manager or build from source.

And we need to select which servers you want to add to the HAProxy configuration and some additional information like:

Role: It can be Active or Backup.

Include: Yes or No.

Connection address information.

Also, we can configure Advanced Settings like Admin User, Backend Name, Timeouts, and more.

When you finish the configuration and confirm the deploy, we can follow the progress in the Activity section on ClusterControl UI.

Setup HAProxy Server ClusterControl

And when this finishes, we can go to ClusterControl -> Nodes -> HAProxy node, and check the current status.

HAProxy Node in ClusterControl

We can also monitor our HAProxy servers from ClusterControl checking the Dashboard section.

HAProxy Monitoring with ClusterControl

We can improve our HA design adding a new HAProxy node and configuring Keepalived service between them. All this can be performed by ClusterControl. 

What is Amazon Elastic Load Balancing?

HAProxy is not the only possibility to deploy a Load Balancer on AWS as they have their own product for this task. Amazon Elastic Load Balancing (or ELB) distributes incoming application or network traffic across multiple targets, such as Amazon EC2 instances, containers, and IP addresses, in multiple Availability Zones. 

You can add and remove compute resources from your load balancer as your needs change, without disrupting the overall flow of requests to your applications.

You can configure health checks, which are used to monitor the health of the compute resources so that the load balancer can send requests only to the healthy ones. You can also offload the work of encryption and decryption to your load balancer so that your compute resources can focus on their main work.

To configure it, go to the Amazon EC2 section, and click on the Load Balancers option in the left menu. There, we’ll see three different options.

Amazon EC2 Elastic Load Balancing ELB
  • Application Load Balancer: If you need a flexible feature set for your web applications with HTTP and HTTPS traffic. Operating at the request level, Application Load Balancers provide advanced routing and visibility features targeted at application architectures, including microservices and containers.
  • Network Load Balancer: If you need ultra-high performance, TLS offloading at scale, centralized certificate deployment, support for UDP, and static IP addresses for your application. Operating at the connection level, Network Load Balancers are capable of handling millions of requests per second securely while maintaining ultra-low latencies.
  • Classic Load Balancer: If you have an existing application running in the EC2-Classic network.

Conclusion

As we could see, a Load Balancer can help us manage our database traffic by balancing it between multiple servers. It’s also useful to improve our high availability environment by performing failover tasks. We can deploy it manually on AWS or by using ClusterControl in a fast and easy way. With ClusterControl (download for FREE!) we can also take advantage of different features like monitoring, management and scaling for different database technologies, and we can deploy this system on-prem or in the cloud.

Database Load Balancing with ProxySQL & AWS Aurora

$
0
0

ProxySQL is a proven solution that helps database administrators dealing with the requirements for high availability of their databases. Because it is SQL-aware, it can also be used for shaping the traffic heading towards databases - you can route queries to the particular nodes, you can rewrite queries should that be needed, you can also throttle the traffic, implement SQL firewall, create a mirror of your traffic and send it to a separate hostgroup. 

ProxySQL 2.0.5 natively supports Galera Cluster, MySQL Replication and MySQL Group Replication. Unfortunately it does not, by default, support AWS Aurora; but there is still a workaround you can use.

You may be asking yourself, why should I bother with ProxySQL when AWS provides me with an endpoint which will do the read-write split for me? That’s indeed the case but it is just the r/w split. ProxySQL, on the other hand, gives you an opportunity for not only separating reads from writes but also to take control of your database traffic. ProxySQL often can save your databases from being overloaded by just rewriting a single query.

ProxySQL 2.0.5 and AWS Aurora

Should you decide to give ProxySQL a try, there are a couple of steps you have to take. First, you will need an EC2 instance to install the ProxySQL on. Once you have the instance up and running, you can install the latest ProxySQL. We would recommend to use repository for that. You can set it up by following the steps in the documentation page: https://github.com/sysown/proxysql/wiki. For Ubuntu 16.04 LTS, which we used, you have to run:

apt-get install -y lsb-release

wget -O - 'https://repo.proxysql.com/ProxySQL/repo_pub_key' | apt-key add -

echo deb https://repo.proxysql.com/ProxySQL/proxysql-2.0.x/$(lsb_release -sc)/ ./ \

| tee /etc/apt/sources.list.d/proxysql.list

Then it’s time to install ProxySQL:

apt-get update

apt-get install proxysql

Then we have to verify that we do have the connectivity from our ProxySQL instance to AWS Aurora nodes. We will use direct endpoints for the connectivity.

We can easily test the connectivity using telnet to the correct endpoint on port 3306:

root@ip-10-0-0-191:~# telnet dbtest-instance-1.cqb1vho43rod.eu-central-1.rds.amazonaws.com 3306

Trying 10.0.0.53...

Connected to dbtest-instance-1.cqb1vho43rod.eu-central-1.rds.amazonaws.com.

Escape character is '^]'.

J

5.7.12_2>ZWP-&[Ov8NzJ:H#Mmysql_native_password^CConnection closed by foreign host.

First one looks good. We’ll proceed with the second Aurora node:

root@ip-10-0-0-191:~# telnet dbtest-instance-1-eu-central-1a.cqb1vho43rod.eu-central-1.rds.amazonaws.com 3306

Trying 10.0.1.90...

Connected to dbtest-instance-1-eu-central-1a.cqb1vho43rod.eu-central-1.rds.amazonaws.com.

Escape character is '^]'.

J

tr3'3rynMmysql_native_password^CConnection closed by foreign host.

Works great too. If you cannot connect to Aurora nodes you need to ensure that all the security bits are aligned properly: check the VPC configuration, see if ProxySQL node can access VPC of Aurora, check if security groups allow the traffic to pass through. AWS network security layer can be tricky to configure if you don’t have the experience but finally you should be able to make it work.

Having the connectivity sorted out we will need to create a user on Aurora. We will use that user for monitoring Aurora nodes in ProxySQL. First, we may have to install MySQL client on ProxySQL node:

root@ip-10-0-0-191:~# apt install mysql-client-core-5.7

Then we will use the endpoint of the cluster to connect to the writer and create user on it:

root@ip-10-0-0-191:~# mysql -h dbtest.cluster-cqb1vho43rod.eu-central-1.rds.amazonaws.com -u root -ppassword

mysql> CREATE USER 'monuser'@'10.0.0.191' IDENTIFIED BY 'mon1t0r';

Query OK, 0 rows affected (0.02 sec)

mysql> GRANT REPLICATION CLIENT ON *.* TO 'monuser'@'10.0.0.191';

Query OK, 0 rows affected (0.00 sec)

Having this done we can log into ProxySQL admin interface (by default on port 6032) to define the monitor user and its password.

root@ip-10-0-0-191:~# mysql -P6032 -u admin -padmin -h127.0.0.1

mysql> SET mysql-monitor_username='monuser';

Query OK, 1 row affected (0.00 sec)


mysql> SET mysql-monitor_password='mon1t0r';

Query OK, 1 row affected (0.00 sec)

mysql> LOAD MYSQL VARIABLES TO RUNTIME;

Query OK, 0 rows affected (0.00 sec)

mysql> SAVE MYSQL VARIABLES TO DISK;

Query OK, 116 rows affected (0.00 sec)

Now it’s time to define Aurora nodes in ProxySQL:

mysql> INSERT INTO mysql_servers (hostgroup_id, hostname) VALUES (10, 'dbtest-instance-1.cqb1vho43rod.eu-central-1.rds.amazonaws.com'), (20, 'dbtest-instance-1-eu-central-1a.cqb1vho43rod.eu-central-1.rds.amazonaws.com');

Query OK, 2 rows affected (0.01 sec)

As you can see, we use their direct endpoints as the hostname. Once this is done, we will use mysql_replication_hostgroup table to define reader and writer hostgroups. We will also have to pass the correct check type - by default ProxySQL looks for ‘read_only’ variable while Aurora uses ‘innodb_read_only’ to differentiate between the writer and readers.

mysql> SHOW CREATE TABLE mysql_replication_hostgroups\G

*************************** 1. row ***************************

       table: mysql_replication_hostgroups

Create Table: CREATE TABLE mysql_replication_hostgroups (

    writer_hostgroup INT CHECK (writer_hostgroup>=0) NOT NULL PRIMARY KEY,

    reader_hostgroup INT NOT NULL CHECK (reader_hostgroup<>writer_hostgroup AND reader_hostgroup>=0),

    check_type VARCHAR CHECK (LOWER(check_type) IN ('read_only','innodb_read_only','super_read_only')) NOT NULL DEFAULT 'read_only',

    comment VARCHAR NOT NULL DEFAULT '', UNIQUE (reader_hostgroup))

1 row in set (0.00 sec)


mysql> INSERT INTO mysql_replication_hostgroups VALUES (10, 20, 'innodb_read_only', 'Aurora');

Query OK, 1 row affected (0.00 sec)

mysql> LOAD MYSQL SERVERS TO RUNTIME;

Query OK, 0 rows affected (0.00 sec)

This is it, we can now see how ProxySQL configured the nodes in runtime configuration:

mysql> SELECT hostgroup_id, hostname, port  FROM runtime_mysql_servers;

+--------------+-----------------------------------------------------------------------------+------+

| hostgroup_id | hostname                                                                    | port |

+--------------+-----------------------------------------------------------------------------+------+

| 10           | | 3306 |

| 20           | dbtest-instance-1-eu-central-1a.cqb1vho43rod.eu-central-1.rds.amazonaws.com | 3306 |

| 20           | dbtest-instance-1.cqb1vho43rod.eu-central-1.rds.amazonaws.com               | 3306 |

+--------------+-----------------------------------------------------------------------------+------+

3 rows in set (0.00 sec)

As you can see, dbtest-instance-1.cqb1vho43rod.eu-central-1.rds.amazonaws.com is the writer. Let’s try the failover now:

mysql> SELECT hostgroup_id, hostname, port  FROM runtime_mysql_servers;

+--------------+-----------------------------------------------------------------------------+------+

| hostgroup_id | hostname                                                                    | port |

+--------------+-----------------------------------------------------------------------------+------+

| 10           | dbtest-instance-1-eu-central-1a.cqb1vho43rod.eu-central-1.rds.amazonaws.com | 3306 |

| 20           | dbtest-instance-1-eu-central-1a.cqb1vho43rod.eu-central-1.rds.amazonaws.com | 3306 |

| 20           | dbtest-instance-1.cqb1vho43rod.eu-central-1.rds.amazonaws.com               | 3306 |

+--------------+-----------------------------------------------------------------------------+------+

3 rows in set (0.00 sec)

As you can see, writer (hostgroup 10) has changed to the second node.

Conclusion

This is basically it - as you can see setting up AWS Aurora nodes in ProxySQL is pretty much simple process.

Database Load Balancing in the Cloud - MySQL Master Failover with ProxySQL 2.0: Part One (Deployment)

$
0
0

The cloud provides very flexible environments to work with. You can easily scale it up and down by adding or removing nodes. If there’s a need, you can easily create a clone of your environment. This can be used for processes like upgrades, load tests, disaster recovery. The main problem you have to deal with is that applications have to connect to the databases in some way, and flexible setups can be tricky for databases - especially with master-slave setups. Luckily, there are some options to make this process easier. 

One way is to utilize a database proxy. There are several proxies to pick from, but in this blog post we will use ProxySQL, a well known proxy available for MySQL and MariaDB. We are going to show how you can use it to efficiently move traffic between MySQL nodes without visible impact for the application. We are also going to explain some limitations and drawbacks of this approach.

Initial Cloud Setup

At first, let’s discuss the setup. We will use AWS EC2 instances for our environment. As we are only testing, we don’t really care about high availability other than what we want to prove to be possible - seamless master changes. Therefore we will use a single application node and a single ProxySQL node. As per good practices, we will collocate ProxySQL on the application node and the application will be configured to connect to ProxySQL through Unix socket. This will reduce overhead related to TCP connections and increase security - traffic from the application to the proxy will not leave the local instance, leaving only ProxySQL - > MySQL connection to encrypt. Again, as this is a simple test, we will not setup SSL. In production environments you want to do that, even if you use VPC.

The environment will look like in the diagram below:

As the application, we will use Sysbench - a synthetic benchmark program for MySQL. It has an option to disable and enable the use of transactions, which we will use to demonstrate how ProxySQL handles them.

Installing a MySQL Replication Cluster Using ClusterControl

To make the deployment fast and efficient, we are going to use ClusterControl to deploy the MySQL replication setup for us. The installation of ClusterControl requires just a couple of steps. We won’t go into details here but you should open our website, register and installation of ClusterControl should be pretty much straightforward. Please keep in mind that you need to setup passwordless SSH between ClusterControl instance and all nodes that we will be managing with it.

Once ClusterControl has been installed, you can log in. You will be presented with a deployment wizard:

As we already have instances running in cloud, therefore we will just go with “Deploy” option. We will be presented with the following screen:

We will pick MySQL Replication as the cluster type and we need to provide connectivity details. It can be connection using root user or it can as well be a sudo user with or without a password.

In the next step, we have to make some decisions. We will use Percona Server for MySQL in its latest version. We also have to define a password for the root user on the nodes we will deploy.

In the final step we have to define a topology - we will go with what we proposed at the beginning - a master and three slaves.

ClusterControl will start the deployment - we can track it in the Activity tab, as shown on the screenshot above.

Once the deployment has completed, we can see the cluster in the cluster list:

Installing ProxySQL 2.0 Using ClusterControl

The next step will be to deploy ProxySQL. ClusterControl can do this for us.

We can do this in Manage -> Load Balancer.

As we are just testing things, we are going to reuse the ClusterControl instance for ProxySQL and Sysbench. In real life you would probably want to use your “real” application server. If you can’t find it in the drop down, you can always write the server address (IP or hostname) by hand.

We also want to define credentials for monitoring and administrative user. We also double-checked that ProxySQL 2.0 will be deployed (you can always change it to 1.4.x if you need).

On the bottom part of the wizard we will define the user which will be created in both MySQL and ProxySQL. If you have an existing application, you probably want to use an existing user. If you use numerous users for your application you can always import the rest of them later, after ProxySQL will be deployed.

We want to ensure that all the MySQL instances will be configured in ProxySQL. We will use explicit transactions so we set the switch accordingly. This is all we needed to do - the rest is to click on the “Deploy ProxySQL” button and let ClusterControl does its thing.

When the installation is completed, ProxySQL will show up on the list of nodes in the cluster. As you can see on the screenshot above, it already detected the topology and distributed nodes across reader and writer hostgroups.

Installing Sysbench

The final step will be to create our “application” by installing Sysbench. The process is fairly simple. At first we have to install prerequisites, libraries and tools required to compile Sysbench:

root@ip-10-0-0-115:~# apt install git automake libtool make libssl-dev pkg-config libmysqlclient-dev

Then we want to clone the sysbench repository:

root@ip-10-0-0-115:~# git clone https://github.com/akopytov/sysbench.git

Finally we want to compile and install Sysbench:

root@ip-10-0-0-115:~# cd sysbench/

root@ip-10-0-0-115:~/sysbench# ./autogen.sh && ./configure && make && make install

This is it, Sysbench has been installed. We now need to generate some data. For that, at first, we need to create a schema. We will connect to local ProxySQL and through it we will create a ‘sbtest’ schema on the master. Please note we used Unix socket for connection with ProxySQL.

root@ip-10-0-0-115:~/sysbench# mysql -S /tmp/proxysql.sock -u sbtest -psbtest

mysql> CREATE DATABASE sbtest;

Query OK, 1 row affected (0.01 sec)

Now we can use sysbench to populate the database with data. Again, we do use Unix socket for connection with the proxy:

root@ip-10-0-0-115:~# sysbench /root/sysbench/src/lua/oltp_read_write.lua --threads=4 --events=0 --time=3600 --mysql-socket=/tmp/proxysql.sock --mysql-user=sbtest --mysql-password=sbtest --tables=32 --report-interval=1 --skip-trx=on --table-size=100000 --db-ps-mode=disable prepare

Once the data is ready, we can proceed to our tests. 

Conclusion

In the second part of this blog, we will discuss ProxySQL’s handling of connections, failover and its settings that can help us to manage the master switch in a way that will be the least intrusive to the application.

Announcing ClusterControl 1.7.4: Cluster-to-Cluster Replication - Ultimate Disaster Recovery

$
0
0

We’re excited to announce the 1.7.4 release of ClusterControl - the only database management system you’ll ever need to take control of your open source database infrastructure. 

In this release we launch a new function that could be the ultimate way to minimize RTO as part of your disaster recovery strategy. Cluster-to-Cluster Replication for MySQL and PostgreSQL lets you build-out a clone of your entire database infrastructure and deploy it to a secondary data center, while keeping both synced. This ensures you always have an available up-to-date database setup ready to switch-over to should disaster strike.  

In addition we are also announcing support for the new MariaDB 10.4 / Galera Cluster 4.x as well as support for ProxySQL 2.0, the latest release from the industry leading MySQL load balancer.

Lastly, we continue our commitment to PostgreSQL by releasing new user management functions, giving you complete control over who can access or administer your postgres setup.

Release Highlights

Cluster-to-Cluster Database Replication

  • Asynchronous MySQL Replication Between MySQL Galera Clusters.
  • Streaming Replication Between PostgreSQL Clusters.
  • Ability to Build Clusters from a Backup or by Streaming Directly from a Master Cluster.

Added Support for MariaDB 10.4 & Galera Cluster 4.x

  • Deployment, Configuration, Monitoring and Management of the Newest Version of Galera Cluster Technology, initially released by MariaDB
    • New Streaming Replication Ability
    • New Support for Dealing with Long Running & Large Transactions
    • New Backup Locks for SST

Added Support for ProxySQL 2.0

  • Deployment and Configuration of the Newest Version of the Best MySQL Load Balancer on the Market
    • Native Support for Galera Cluster
    • Enables Causal Reads Using GTID
    • New Support for SSL Frontend Connections
    • Query Caching Improvements

New User Management Functions for PostgreSQL Clusters

  • Take full control of who is able to access your PostgreSQL database.
 

View Release Details and Resources

Release Details

Cluster-to-Cluster Replication

Either streaming from your master or built from a backup, the new Cluster-to-Cluster Replication function in ClusterControl let’s you create a complete disaster recovery database system into another data center; which you can then easily failover to should something go wrong, during maintenance, or during a major outage.

In addition to disaster recovery, this function also allows you to create a copy of your database infrastructure (in just a couple of clicks) which you can use to test upgrades, patches, or to try some database performance enhancements.

You can also use this function to deploy an analytics or reporting setup, allowing you to separate your reporting load from your OLTP traffic.

Cluster to Cluster Replication

PostgreSQL User Management

You now have the ability to add or remove user access to your PostgreSQL setup. With the simple interface, you can specify specific permissions or restrictions at the individual level. It also provides a view of all defined users who have access to the database, with their respective permissions. For tips on best practices around PostgreSQL user management you can check out this blog.

MariaDB 10.4 / Galera Cluster 4.x Support

In an effort to boost performance for long running or large transactions, MariaDB & Codership have partnered to add Streaming Replication to the new MariaDB Cluster 10.4. This addition solves many challenges that this technology has previously experienced with these types of transactions. There are three new system tables added to the release to support this new function as well as new synchronisation functions.  You can read more about what’s included in this release here.

Deploy MariaDB Cluster 10.4
 

Database Load Balancing in the Cloud - MySQL Master Failover with ProxySQL 2.0: Part Two (Seamless Failover)

$
0
0

In the previous blog we showed you how to set up an environment in Amazon AWS EC2 that consists of a Percona Server 8.0 Replication Cluster (in Master - Slave topology). We deployed ProxySQL and we configured our application (Sysbench). 

We also used ClusterControl to make the deployment easier, faster and more stable. This is the environment we ended up with...

This is how it looks in ClusterControl:

In this blog post we are going to review the requirements and show you how, in this setup, you can seamlessly perform master switches.

Seamless Master Switch with ProxySQL 2.0

We are going to benefit from ProxySQL ability to queue connections if there are no nodes available in a hostgroup. ProxySQL utilizes hostgroups to differentiate between backend nodes with different roles. You can see the configuration on the screenshot below.

In our case we have two host groups - hostgroup 10 contains writers (master) and hostgroup 20 contains slaves (and also it may contain master, depends on the configuration). As you may know, ProxySQL uses SQL interface for configuration. ClusterControl exposes most of the configuration options in the UI but some settings cannot be set up via ClusterControl (or they are configured automatically by ClusterControl). One of such settings is how the ProxySQL should detect and configure backend nodes in replication environment.

mysql> SELECT * FROM mysql_replication_hostgroups;

+------------------+------------------+------------+-------------+

| writer_hostgroup | reader_hostgroup | check_type | comment     |

+------------------+------------------+------------+-------------+

| 10               | 20 | read_only  | host groups |

+------------------+------------------+------------+-------------+

1 row in set (0.00 sec)

Configuration stored in mysql_replication_hostgroups table defines if and how ProxySQL will automatically assign master and slaves to correct hostgroups. In short, the configuration above tells ProxySQL to assign writers to HG10, readers to HG20. If a node is a writer or reader is determined by the state of variable ‘read_only’. If read_only is enabled, node is marked as reader and assigned to HG20. If not, node is marked as writer and assigned to HG10. On top of that we have a variable:

Which determines if writer should also show up in the readers’ hostgroup or not. In our case it is set to ‘True’ thus our writer (master) is also a part of HG20.

ProxySQL does not manage backend nodes but it does access them and check the state of them, including the state of the read_only variable. This is done by monitoring user, which has been configured by ClusterControl according to your input at the deployment time for ProxySQL. If the state of the variable changes, ProxySQL will reassign it to proper hostgroup, based on the value for read_only variable and based on the settings in mysql-monitor_writer_is_also_reader variable in ProxySQL.

Here enters ClusterControl. ClusterControl monitors the state of the cluster. Should master is not available, failover will occur. It is more complex than that and we explained this process in detail in one of our earlier blogs. What is important for us is that, as long as it is safe, ClusterControl will execute the failover and in the process it will reconfigure read_only variables on old and new master. ProxySQL will see the change and modify its hostgroups accordingly. This will also happen in case of the regular slave promotion, which can easily be executed from ClusterControl by starting this job:

The final outcome will be that the new master will be promoted and assigned to HG10 in ProxySQL while the old master will be reconfigured as a slave (and it will be a part of HG20 in ProxySQL). The process of master change may take a while depending on environment, application and traffic (it is even possible to failover in  11 seconds, as my colleague has tested). During this time database (master) will not be reachable in ProxySQL. This leads to some problems. For starters, the application will receive errors from the database and user experience will suffer - no one likes to see errors. Luckily, under some circumstances,  we can reduce the impact. The requirement for this is that the application does not use (at all or at that particular time) multi-statement transactions. This is quite expected - if you have a multi-statement transaction (so, BEGIN; … ; COMMIT;) you cannot move it from server to server because this will no longer be a transaction. In such cases the only safe way is to rollback the transaction and start once more on a new master. Prepared statements are also a no-no: they are prepared on a particular host (master) and they do not exist on slaves so once one slave will be promoted to a new master, it is not possible for it to execute prepared statements which has been prepared on old master. On the other hand if you run only auto-committed, single-statement transactions, you can benefit from the feature we are going to describe below.

One of the great features ProxySQL has is an ability to queue incoming transactions if they are directed to a hostgroup that does not have any nodes available. This is defined by following two variables:

ClusterControl increases them to 20 seconds, allowing even for quite some long failovers to perform without any error being sent to the application.

Testing the Seamless Master Switch

We are going to run the test in our environment. As the application we are going to use SysBench started as:

while true ; do sysbench /root/sysbench/src/lua/oltp_read_write.lua --threads=4 --events=0 --time=3600 --reconnect=1 --mysql-socket=/tmp/proxysql.sock --mysql-user=sbtest --mysql-password=sbtest --tables=32 --report-interval=1 --skip-trx=on --table-size=100000 --db-ps-mode=disable --rate=5 run ; done

Basically, we will run sysbench in a loop (in case an error show up). We will run it in 4 threads. Threads will reconnect after every transaction. There will be no multi-statement transactions and we will not use prepared statements. Then we will trigger the master switch by promoting a slave in the ClusterControl UI. This is how the master switch looks like from the application standpoint:

[ 560s ] thds: 4 tps: 5.00 qps: 90.00 (r/w/o: 70.00/20.00/0.00) lat (ms,95%): 18.95 err/s: 0.00 reconn/s: 5.00

[ 560s ] queue length: 0, concurrency: 0

[ 561s ] thds: 4 tps: 5.00 qps: 90.00 (r/w/o: 70.00/20.00/0.00) lat (ms,95%): 17.01 err/s: 0.00 reconn/s: 5.00

[ 561s ] queue length: 0, concurrency: 0

[ 562s ] thds: 4 tps: 7.00 qps: 126.00 (r/w/o: 98.00/28.00/0.00) lat (ms,95%): 28.67 err/s: 0.00 reconn/s: 7.00

[ 562s ] queue length: 0, concurrency: 0

[ 563s ] thds: 4 tps: 3.00 qps: 68.00 (r/w/o: 56.00/12.00/0.00) lat (ms,95%): 17.95 err/s: 0.00 reconn/s: 3.00

[ 563s ] queue length: 0, concurrency: 1

We can see that the queries are being executed with low latency.

[ 564s ] thds: 4 tps: 0.00 qps: 42.00 (r/w/o: 42.00/0.00/0.00) lat (ms,95%): 0.00 err/s: 0.00 reconn/s: 0.00

[ 564s ] queue length: 1, concurrency: 4

Then the queries paused - you can see this by the latency being zero and transactions per second being equal to zero as well.

[ 565s ] thds: 4 tps: 0.00 qps: 0.00 (r/w/o: 0.00/0.00/0.00) lat (ms,95%): 0.00 err/s: 0.00 reconn/s: 0.00

[ 565s ] queue length: 5, concurrency: 4

[ 566s ] thds: 4 tps: 0.00 qps: 0.00 (r/w/o: 0.00/0.00/0.00) lat (ms,95%): 0.00 err/s: 0.00 reconn/s: 0.00

[ 566s ] queue length: 15, concurrency: 4

Two seconds in queue is growing, still no response coming from the database.

[ 567s ] thds: 4 tps: 20.00 qps: 367.93 (r/w/o: 279.95/87.98/0.00) lat (ms,95%): 3639.94 err/s: 0.00 reconn/s: 20.00

[ 567s ] queue length: 1, concurrency: 4

After three seconds application was finally able to reach the database again. You can see the traffic is now non-zero and the queue length has been reduced. You can see the latency around 3.6 seconds - this is for how long the queries have been paused

[ 568s ] thds: 4 tps: 10.00 qps: 116.04 (r/w/o: 84.03/32.01/0.00) lat (ms,95%): 539.71 err/s: 0.00 reconn/s: 10.00

[ 568s ] queue length: 0, concurrency: 0

[ 569s ] thds: 4 tps: 4.00 qps: 72.00 (r/w/o: 56.00/16.00/0.00) lat (ms,95%): 16.12 err/s: 0.00 reconn/s: 4.00

[ 569s ] queue length: 0, concurrency: 0

[ 570s ] thds: 4 tps: 8.00 qps: 144.01 (r/w/o: 112.00/32.00/0.00) lat (ms,95%): 24.83 err/s: 0.00 reconn/s: 8.00

[ 570s ] queue length: 0, concurrency: 0

[ 571s ] thds: 4 tps: 5.00 qps: 98.99 (r/w/o: 78.99/20.00/0.00) lat (ms,95%): 21.50 err/s: 0.00 reconn/s: 5.00

[ 571s ] queue length: 0, concurrency: 1

[ 572s ] thds: 4 tps: 5.00 qps: 80.98 (r/w/o: 60.99/20.00/0.00) lat (ms,95%): 17.95 err/s: 0.00 reconn/s: 5.00

[ 572s ] queue length: 0, concurrency: 0

[ 573s ] thds: 4 tps: 2.00 qps: 36.01 (r/w/o: 28.01/8.00/0.00) lat (ms,95%): 14.46 err/s: 0.00 reconn/s: 2.00

[ 573s ] queue length: 0, concurrency: 0

Everything is stable again, total impact for the master switch was 3.6 second increase in the latency and no traffic hitting database for 3.6 seconds. Other than that the master switch was transparent to the application. Of course, whether it will be 3.6 seconds or more depends on the environment, traffic and so on but as long as the master switch can be performed under 20 seconds, no error will be returned to the application.

Conclusion

As you can see, with ClusterControl and ProxySQL 2.0 you are just a couple of clicks from achieving a seamless failover and master switch for your MySQL Replication clusters.


Understanding the ProxySQL Audit Log

$
0
0

ProxySQL became a very important bit of infrastructure in the database environments. It works as a load balancer, it helps to shape the flow of the traffic and reduce the downtime. With great power comes great responsibility. How can you stay up to date on who is accessing the ProxySQL configuration? Who is connecting to the database through ProxySQL? Those questions can be answered using ProxySQL Audit Log, which is available starting from ProxySQL 2.0.5. In this blog post we will look into how to enable this feature and how the log contents look like.

The initial steps will be to deploy ProxySQL. We can easily do that using ClusterControl - both MySQL Replication and Galera Cluster types support ProxySQL deployment.

Assuming we have a cluster up and running, we can deploy ProxySQL from Manage -> LoadBalancers:

We have to decide on which node ProxySQL should be installed, its version (we’ll keep the default 2.x) and define credentials for ProxySQL administrative and monitoring users.

Below we can either import existing application users from the database or create a new one by assigning name, password, schema and MySQL privileges. We can then configure which nodes should be included in ProxySQL and decide if we use implicit transactions or not. Once everything is done, we can deploy ProxySQL. For high availability you probably want to add a second ProxySQL and then keepalived on top of them. Keepalived can also be easily deployed from ClusterControl:

Here we have to pick nodes on which ProxySQL is deployed, pass the Virtual IP and network interface VIP should be assigned to. Once this is done, ClusterControl can deploy Keepalived for you.

Now, let’s take a look at the audit log. All configurations should be performed on both ProxySQL nodes. Alternatively you can use an option to sync the nodes:

There are two settings that govern how the audit log should work:

The first one defines the file where data should be stored, the second tells how large the log file should be before it’ll be rotated. Let’s configure log in ProxySQL data directory:

Now, we can take a look at the data we see in the audit log file. First of all, the format in which data is stored is JSON. There are two types of events, one related to MySQL connectivity and second related to ProxySQL admin interface connectivity.

Here is an example of entries triggered by MySQL traffic:

"client_addr": "10.0.0.100:40578",

  "event": "MySQL_Client_Connect_OK",

  "proxy_addr": "0.0.0.0:6033",

  "schemaname": "sbtest",

  "ssl": false,

  "thread_id": 810,

  "time": "2020-01-23 14:24:17.595",

  "timestamp": 1579789457595,

  "username": "sbtest"

}

{

  "client_addr": "10.0.0.100:40572",

  "event": "MySQL_Client_Quit",

  "proxy_addr": "0.0.0.0:6033",

  "schemaname": "sbtest",

  "ssl": false,

  "thread_id": 807,

  "time": "2020-01-23 14:24:17.657",

  "timestamp": 1579789457657,

  "username": "sbtest"

}

{

  "client_addr": "10.0.0.100:40572",

  "creation_time": "2020-01-23 14:24:17.357",

  "duration": "299.653ms",

  "event": "MySQL_Client_Close",

  "extra_info": "MySQL_Thread.cpp:4307:process_all_sessions()",

  "proxy_addr": "0.0.0.0:6033",

  "schemaname": "sbtest",

  "ssl": false,

  "thread_id": 807,

  "time": "2020-01-23 14:24:17.657",

  "timestamp": 1579789457657,

  "username": "sbtest"

}

As you can see, most of the data repeats: client address, ProxySQL address, schema name, if SSL was used in connections, related thread number in MySQL, user that created the connection. The “MySQL_Client_Close” event also contains information about the time when the connection was created and the duration of the connection. You can also see which part of ProxySQL code was responsible for closing the connection.

Admin connections are quite similar:

{

  "client_addr": "10.0.0.100:52056",

  "event": "Admin_Connect_OK",

  "schemaname": "information_schema",

  "ssl": false,

  "thread_id": 815,

  "time": "2020-01-23 14:24:19.490",

  "timestamp": 1579789459490,

  "username": "proxysql-admin"

}

{

  "client_addr": "10.0.0.100:52056",

  "event": "Admin_Quit",

  "schemaname": "information_schema",

  "ssl": false,

  "thread_id": 815,

  "time": "2020-01-23 14:24:19.494",

  "timestamp": 1579789459494,

  "username": "proxysql-admin"

}

{

  "client_addr": "10.0.0.100:52056",

  "creation_time": "2020-01-23 14:24:19.482",

  "duration": "11.795ms",

  "event": "Admin_Close",

  "extra_info": "MySQL_Thread.cpp:3123:~MySQL_Thread()",

  "schemaname": "information_schema",

  "ssl": false,

  "thread_id": 815,

  "time": "2020-01-23 14:24:19.494",

  "timestamp": 1579789459494,

  "username": "proxysql-admin"

}

The data collected is very similar, the main difference is that it is related to connections to the ProxySQL administrative interface.

Conclusion

As you can see, in a very easy way you can enable auditing of the access to ProxySQL. This, especially the administrative access, is something which should be monitored from the security standpoint. Audit plugin makes it quite easy to accomplish.

How to Install and Configure MaxScale for MariaDB

$
0
0

There are different reasons for adding a load balancer between your application and your database. If you have high traffic (and you want to balance the traffic between different database nodes) or you want to use the load balancer as a single endpoint (so in case of failover, this load balancer will cope with this issue sending the traffic to the available/healthy node.) It could also be that you want to use different ports to write and read data from your database. 

In all these cases, a load balancer will be useful for you, and if you have a MariaDB cluster, one option for this is using MaxScale which is a database proxy for MariaDB databases.

In this blog, we will show you how to install and configure it manually, and how ClusterControl can help you in this task. For this example, we will use a MariaDB replication cluster with 1 master and 1 slave node, and CentOS8 as the operating system.

How to Install MaxScale

We will assume you have your MariaDB database up and running, and also a machine (virtual or physical) to install MaxScale. We recommend you use a different host, so in case of master failure, MaxScale can failover to the slave node, otherwise, MaxScale can’t take any action if the server where it is running goes down.

There are different ways to install MaxScale, in this case, we will use the MariaDB repositories. To add it into the MaxScale server, you have to run:

$ curl -sS https://downloads.mariadb.com/MariaDB/mariadb_repo_setup | sudo bash

[info] Repository file successfully written to /etc/yum.repos.d/mariadb.repo

[info] Adding trusted package signing keys...

[info] Successfully added trusted package signing keys

Now, install the MaxScale package:

$ yum install maxscale

Now you have your MaxScale node installed, before starting, you need to configure it.

How to Configure MaxScale

As MaxScale perform tasks like authentication, monitoring, and more, you need to create a database user with some specific privileges:

MariaDB [(none)]> CREATE USER 'maxscaleuser'@'%' IDENTIFIED BY 'maxscalepassword';

MariaDB [(none)]> GRANT SELECT ON mysql.user TO 'maxscaleuser'@'%';

MariaDB [(none)]> GRANT SELECT ON mysql.db TO 'maxscaleuser'@'%';

MariaDB [(none)]> GRANT SELECT ON mysql.tables_priv TO 'maxscaleuser'@'%';

MariaDB [(none)]> GRANT SELECT ON mysql.roles_mapping TO 'maxscaleuser'@'%';

MariaDB [(none)]> GRANT SHOW DATABASES ON *.* TO 'maxscaleuser'@'%';

MariaDB [(none)]> GRANT REPLICATION CLIENT on *.* to 'maxscaleuser'@'%';

Keep in mind that MariaDB versions 10.2.2 to 10.2.10 also require:

MariaDB [(none)]> GRANT SELECT ON mysql.* TO 'maxscaleuser'@'%';

Now you have the database user ready, let’s see the configuration files. When you install MaxScale, the file maxscale.cnf will be created under /etc/. There are several variables and different ways to configure it, so let’s see an example:

$ cat  /etc/maxscale.cnf 

# Global parameters

[maxscale]

threads = auto

log_augmentation = 1

ms_timestamp = 1

syslog = 1


# Server definitions

[server1]

type=server

address=192.168.100.126

port=3306

protocol=MariaDBBackend

[server2]

type=server

address=192.168.100.127

port=3306

protocol=MariaDBBackend


# Monitor for the servers

[MariaDB-Monitor]

type=monitor

module=mariadbmon

servers=server1,server2

user=maxscaleuser

password=maxscalepassword

monitor_interval=2000


# Service definitions

[Read-Only-Service]

type=service

router=readconnroute

servers=server2

user=maxscaleuser

password=maxscalepassword

router_options=slave

[Read-Write-Service]

type=service

router=readwritesplit

servers=server1

user=maxscaleuser

password=maxscalepassword


# Listener definitions for the services

[Read-Only-Listener]

type=listener

service=Read-Only-Service

protocol=MariaDBClient

port=4008

[Read-Write-Listener]

type=listener

service=Read-Write-Service

protocol=MariaDBClient

port=4006

In this configuration, we have 2 database nodes, 192.168.100.126 (Master) and 192.168.100.127 (Slave), as you can see in the Servers Definition section.

We have also 2 different services, one for read-only, where there is the slave node, and another one for read-write where there is the master node.

Finally, we have 2 listeners, one for each service. The read-only listener, listening in the port 4008, and the read-write one, listening in the port 4006.

This is a basic configuration file. If you need something more specific you can follow the official MariaDB documentation.

Now you are ready to start it, so just run:

$ systemctl start maxscale.service

And check it:

$ maxctrl list services
ff
$ maxctrl list servers

You can find a maxctrl commands list here, or you can even use maxadmin to manage it.

Now let’s test the connection. For this, you can try to access your database using the MaxScale IP address and the port that you want to test. In our case, the traffic on the port 4006 should be sent to server1, and the traffic on the port 4008 to server2.

$ mysql -h 192.168.100.128 -umaxscaleuser -pmaxscalepassword -P4006 -e 'SELECT @@hostname;'

+------------+

| @@hostname |

+------------+

| server1   |

+------------+

$ mysql -h 192.168.100.128 -umaxscaleuser -pmaxscalepassword -P4008 -e 'SELECT @@hostname;'

+------------+

| @@hostname |

+------------+

| server2   |

+------------+

It works!

How to Deploy MaxScale with ClusterControl

Let’s see now, how you can use ClusterControl to simplify this task. For this, we will assume you have your MariaDB cluster added to ClusterControl.

Go to ClusterControl -> Select the MariaDB cluster -> Cluster Actions -> Add Load Balancer -> MaxScale.

Here you can deploy a new MaxScale node or you can also import an existing one. If you are deploying it, you need to add the IP Address or Hostname, the admin and user MaxScale credentials, amount of threads, and ports (write and read-only). You can also specify which database node you want to add to the MaxScale configuration.

You can monitor the task in the ClusterControl Activity section. When it finishes, you will have a new MaxScale node in your MariaDB cluster.

And running the MaxScale commands from the ClusterControl UI without the need of accessing the server via SSH.

It looks easier than deploying it manually, right?

Conclusion

Having a Load Balancer is a good solution if you want to balance or split your traffic, or even for failover actions, and MaxScale, as a MariaDB product, is a good option for MariaDB databases

The installation is easy, but the configuration and usage could be difficult if it is something new for you. In that case, you can use ClusterControl to deploy, configure, and manage it in an easier way.

How to Replace an Intermediate MySQL or MariaDB Master with a Binlog Server using MaxScale

$
0
0

Binary logs (binlogs) contain records of all changes to the databases. They are necessary for replication and can also be used to restore data after a backup. A binlog server is basically a binary log repository. You can think of it like a server with a dedicated purpose to retrieve binary logs from a master, while slave servers can connect to it like they would connect to a master server.

Some advantages of having a binlog server over intermediate master to distribute replication workload are:

  • You can switch to a new master server without the slaves noticing that the actual master server has changed. This allows for a more highly available replication setup where replication is high-priority.
  • Reduce the load on the master by only serving Maxscale’s binlog server instead of all the slaves.
  • The data in the binary log of the intermediate master is not a direct copy of the data that was received from the binary log of the real master. As such, if group commit is used, this can cause a reduction in the parallelism of the commits and a subsequent reduction in the performance of the slave servers.
  • Intermediate slave has to re-execute every SQL statement which potentially adds latency and lags into the replication chain.

In this blog post, we are going to look into how to replace an intermediate master (a slave host relay to other slaves in a replication chain) with a binlog server running on MaxScale for better scalability and performance.

Architecture

We basically have a 4-node MariaDB v10.4 replication setup with one MaxScale v2.3 sitting on top of the replication to distribute incoming queries. Only one slave is connected to a master (intermediate master) and the other slaves replicate from the intermediate master to serve read workloads, as illustrated in the following diagram.

We are going to turn the above topology into this:

Basically, we are going to remove the intermediate master role and replace it with a binlog server running on MaxScale. The intermediate master will be converted to a standard slave, just like other slave hosts. The binlog service will be listening on port 5306 on the MaxScale host. This is the port that all slaves will be connecting to for replication later on.

Configuring MaxScale as a Binlog Server

In this example, we already have a MaxScale sitting on top of our replication cluster acting as a load balancer for our applications. If you don't have a MaxScale, you can use ClusterControl to deploy simply go to Cluster Actions -> Add Load Balancer -> MaxScale and fill up the necessary information as the following:

Before we get started, let's export the current MaxScale configuration into a text file for backup. MaxScale has a flag called --export-config for this purpose but it must be executed as maxscale user. Thus, the command to export is:

$ su -s /bin/bash -c '/bin/maxscale --export-config=/tmp/maxscale.cnf' maxscale

On the MariaDB master, create a replication slave user called 'maxscale_slave' to be used by the MaxScale and assign it with the following privileges:

$ mysql -uroot -p -h192.168.0.91 -P3306

CREATE USER 'maxscale_slave'@'%' IDENTIFIED BY 'BtF2d2Kc8H';

GRANT SELECT ON mysql.user TO 'maxscale_slave'@'%';

GRANT SELECT ON mysql.db TO 'maxscale_slave'@'%';

GRANT SELECT ON mysql.tables_priv TO 'maxscale_slave'@'%';

GRANT SELECT ON mysql.roles_mapping TO 'maxscale_slave'@'%';

GRANT SHOW DATABASES ON *.* TO 'maxscale_slave'@'%';

GRANT REPLICATION SLAVE ON *.* TO 'maxscale_slave'@'%';

For ClusterControl users, go to Manage -> Schemas and Users to create the necessary privileges.

Before we move further with the configuration, it's important to review the current state and topology of our backend servers:

$ maxctrl list servers

┌────────┬──────────────┬──────┬─────────────┬──────────────────────────────┬───────────┐

│ Server │ Address      │ Port │ Connections │ State                        │ GTID │

├────────┼──────────────┼──────┼─────────────┼──────────────────────────────┼───────────┤

│ DB_757 │ 192.168.0.90 │ 3306 │ 0           │ Master, Running │ 0-38001-8 │

├────────┼──────────────┼──────┼─────────────┼──────────────────────────────┼───────────┤

│ DB_758 │ 192.168.0.91 │ 3306 │ 0           │ Relay Master, Slave, Running │ 0-38001-8 │

├────────┼──────────────┼──────┼─────────────┼──────────────────────────────┼───────────┤

│ DB_759 │ 192.168.0.92 │ 3306 │ 0           │ Slave, Running │ 0-38001-8 │

├────────┼──────────────┼──────┼─────────────┼──────────────────────────────┼───────────┤

│ DB_760 │ 192.168.0.93 │ 3306 │ 0           │ Slave, Running │ 0-38001-8 │

└────────┴──────────────┴──────┴─────────────┴──────────────────────────────┴───────────┘

As we can see, the current master is DB_757 (192.168.0.90). Take note of this information as we are going to setup the binlog server to replicate from this master.

Open the MaxScale configuration file at /etc/maxscale.cnf and add the following lines:

[replication-service]

type=service

router=binlogrouter

user=maxscale_slave

password=BtF2d2Kc8H

version_string=10.4.12-MariaDB-log

server_id=9999

master_id=9999

mariadb10_master_gtid=true

filestem=binlog

binlogdir=/var/lib/maxscale/binlogs

semisync=true # if semisync is enabled on the master


[binlog-server-listener]

type=listener

service=replication-service

protocol=MariaDBClient

port=5306

address=0.0.0.0

A bit of explanation - We are creating two components - service and listener. Service is where we define the binlog server characteristic and how it should run. Details on every option can be found here. In this example, our replication servers are running with semi-sync replication, thus we have to use semisync=true so it will connect to the master via semi-sync replication method. The listener is where we map the listening port with the binlogrouter service inside MaxScale.

Restart MaxScale to load the changes:

$ systemctl restart maxscale

Verify the binlog service is started via maxctrl (look at the State column):

$ maxctrl show service replication-service

Verify that MaxScale is now listening to a new port for the binlog service:

$ netstat -tulpn | grep maxscale

tcp        0 0 0.0.0.0:3306            0.0.0.0:* LISTEN   4850/maxscale

tcp        0 0 0.0.0.0:3307            0.0.0.0:* LISTEN   4850/maxscale

tcp        0 0 0.0.0.0:5306            0.0.0.0:* LISTEN   4850/maxscale

tcp        0 0 127.0.0.1:8989          0.0.0.0:* LISTEN   4850/maxscale

We are now ready to establish a replication link between MaxScale and the master.

Activating the Binlog Server

Log into the MariaDB master server and retrieve the current binlog file and position:

MariaDB> SHOW MASTER STATUS;

+---------------+----------+--------------+------------------+

| File          | Position | Binlog_Do_DB | Binlog_Ignore_DB |

+---------------+----------+--------------+------------------+

| binlog.000005 |     4204 | |                 |

+---------------+----------+--------------+------------------+

Use BINLOG_GTID_POS function to get the GTID value:

MariaDB> SELECT BINLOG_GTID_POS("binlog.000005", 4204);

+----------------------------------------+

| BINLOG_GTID_POS("binlog.000005", 4204) |

+----------------------------------------+

| 0-38001-31                             |

+----------------------------------------+

Back to the MaxScale server, install MariaDB client package:

$ yum install -y mysql-client

Connect to the binlog server listener on port 5306 as maxscale_slave user and establish a replication link to the designated master. Use the GTID value retrieved from the master:

(maxscale)$ mysql -u maxscale_slave -p'BtF2d2Kc8H' -h127.0.0.1 -P5306

MariaDB> SET @@global.gtid_slave_pos = '0-38001-31';

MariaDB> CHANGE MASTER TO MASTER_HOST = '192.168.0.90', MASTER_USER = 'maxscale_slave', MASTER_PASSWORD = 'BtF2d2Kc8H', MASTER_PORT=3306, MASTER_USE_GTID = slave_pos;

MariaDB> START SLAVE;

MariaDB [(none)]> SHOW SLAVE STATUS\G

*************************** 1. row ***************************

                 Slave_IO_State: Binlog Dump

                  Master_Host: 192.168.0.90

                  Master_User: maxscale_slave

                  Master_Port: 3306

             Slave_IO_Running: Yes

            Slave_SQL_Running: Yes

             Master_Server_Id: 38001

             Master_Info_File: /var/lib/maxscale/binlogs/master.ini

      Slave_SQL_Running_State: Slave running

                  Gtid_IO_Pos: 0-38001-31

Note: The above output has been truncated to show only important lines.

Pointing Slaves to the Binlog Server

Now on mariadb2 and mariadb3 (the end slaves), change the master pointing to the MaxScale binlog server. Since we are running with semi-sync replication enabled, we have to turn them off first:

(mariadb2 & mariadb3)$ mysql -uroot -p

MariaDB> STOP SLAVE;

MariaDB> SET global rpl_semi_sync_master_enabled = 0; -- if semisync is enabled

MariaDB> SET global rpl_semi_sync_slave_enabled = 0; -- if semisync is enabled

MariaDB> CHANGE MASTER TO MASTER_HOST = '192.168.0.95', MASTER_USER = 'maxscale_slave', MASTER_PASSWORD = 'BtF2d2Kc8H', MASTER_PORT=5306, MASTER_USE_GTID = slave_pos;

MariaDB> START SLAVE;

MariaDB> SHOW SLAVE STATUS\G

*************************** 1. row ***************************

                Slave_IO_State: Waiting for master to send event

                   Master_Host: 192.168.0.95

                   Master_User: maxscale_slave

                   Master_Port: 5306

              Slave_IO_Running: Yes

             Slave_SQL_Running: Yes

              Master_Server_Id: 9999

                    Using_Gtid: Slave_Pos

                   Gtid_IO_Pos: 0-38001-32

       Slave_SQL_Running_State: Slave has read all relay log; waiting for the slave I/O thread to update it

Note: The above output has been truncated to show only important lines.

Inside my.cnf, we have to comment the following lines to disable semi-sync in the future:

#loose_rpl_semi_sync_slave_enabled=ON

#loose_rpl_semi_sync_master_enabled=ON

At this point, the intermediate master (mariadb1) is still replicating from the master (mariadb0) while other slaves have been replicating from the binlog server. Our current topology can be illustrated like the diagram below:

The final part is to change the master pointing of the intermediate master (mariadb1) after all slaves that used to attach to it are no longer there. The steps are basically the same with the other slaves:

(mariadb1)$ mysql -uroot -p

MariaDB> STOP SLAVE;

MariaDB> SET global rpl_semi_sync_master_enabled = 0; -- if semisync is enabled

MariaDB> SET global rpl_semi_sync_slave_enabled = 0; -- if semisync is enabled

MariaDB> CHANGE MASTER TO MASTER_HOST = '192.168.0.95', MASTER_USER = 'maxscale_slave', MASTER_PASSWORD = 'BtF2d2Kc8H', MASTER_PORT=5306, MASTER_USE_GTID = slave_pos;

MariaDB> START SLAVE;

MariaDB> SHOW SLAVE STATUS\G

*************************** 1. row ***************************

                Slave_IO_State: Waiting for master to send event

                   Master_Host: 192.168.0.95

                   Master_User: maxscale_slave

                   Master_Port: 5306

              Slave_IO_Running: Yes

             Slave_SQL_Running: Yes

              Master_Server_Id: 9999

                    Using_Gtid: Slave_Pos

                   Gtid_IO_Pos: 0-38001-32

Note: The above output has been truncated to show only important lines.

Don't forget to disable semi-sync replication in my.cnf as well:

#loose_rpl_semi_sync_slave_enabled=ON

#loose_rpl_semi_sync_master_enabled=ON

We can the verify the binlog router service has more connections now via maxctrl CLI:

$ maxctrl list services

┌─────────────────────┬────────────────┬─────────────┬───────────────────┬───────────────────────────────────┐

│ Service             │ Router │ Connections │ Total Connections │ Servers                           │

├─────────────────────┼────────────────┼─────────────┼───────────────────┼───────────────────────────────────┤

│ rw-service          │ readwritesplit │ 1         │ 1 │ DB_757, DB_758, DB_759, DB_760    │

├─────────────────────┼────────────────┼─────────────┼───────────────────┼───────────────────────────────────┤

│ rr-service          │ readconnroute │ 1         │ 1 │ DB_757, DB_758, DB_759, DB_760    │

├─────────────────────┼────────────────┼─────────────┼───────────────────┼───────────────────────────────────┤

│ replication-service │ binlogrouter   │ 4 │ 51 │ binlog_router_master_host, DB_757 │

└─────────────────────┴────────────────┴─────────────┴───────────────────┴───────────────────────────────────┘

Also, common replication administration commands can be used inside the MaxScale binlog server, for example, we can verify the connected slave hosts by using this command:

(maxscale)$ mysql -u maxscale_slave -p'BtF2d2Kc8H' -h127.0.0.1 -P5306

MariaDB> SHOW SLAVE HOSTS;

+-----------+--------------+------+-----------+------------+

| Server_id | Host         | Port | Master_id | Slave_UUID |

+-----------+--------------+------+-----------+------------+

| 38003     | 192.168.0.92 | 3306 | 9999      | |

| 38002     | 192.168.0.91 | 3306 | 9999      | |

| 38004     | 192.168.0.93 | 3306 | 9999      | |

+-----------+--------------+------+-----------+------------+

At this point, our topology is looking as what we anticipated:

Our migration from intermediate master setup to binlog server setup is now complete.


Database Load Balancing on Google Cloud Platform (GCP) Using HAProxy

$
0
0

Using a Load Balancer is a good idea for any database technology, as you can redirect applications to the available or healthy database nodes and even distribute the traffic across multiple servers to improve performance. This is not only useful on-prem but also in a cloud environment. In this blog, we’ll see how to deploy and configure a new database cluster with HAProxy on the Google Cloud Platform from scratch.

Creating the VM on Google Cloud

For this example, we’ll assume that you have a Google Cloud account created.

You can deploy your virtual machines directly from ClusterControl. Go to the deploy section and select “Deploy in the Cloud”.

Specify vendor and version for your new cluster.

Add the number of nodes, cluster name, and database information.

Choose the cloud credentials, in this case, your Google Cloud account. If you don’t have your account added in ClusterControl, you can follow our documentation for this task.

Now you can specify the virtual machine configuration, like operating system, size, and region.

ClusterControl will create the virtual machines, install the software, and configure it, all in the same job and in an unattended way.

You can monitor the creation process in the ClusterControl activity section. When it finishes, you will see your new cluster in the ClusterControl main screen.

Deploying HAProxy in Google Cloud

Note: To deploy it, first, you need to create the VM in the Google Cloud Platform as the virtual machine creation is not implemented for the ClusterControl load balancer deployment yet (it will be available soon).

Now you have your new cluster up and running, go to ClusterControl -> Select Cluster -> Cluster Actions -> Add Load Balancer.

Here you must add the information that ClusterControl will use to install and configure your HAProxy load balancer.

The information that you need to introduce is:

Action: Deploy or Import.

Server Address: IP Address for your HAProxy server.

Listen Port (Read/Write): Port for read/write mode.

Listen Port (Read-Only): Port for read-only mode.

Policy: It can be:

  • leastconn: The server with the lowest number of connections receives the connection.
  • roundrobin: Each server is used in turns, according to their weights.
  • source: The source IP address is hashed and divided by the total weight of the running servers to designate which server will receive the request.

Install for read/write splitting: For master-slave replication.

Build from Source: You can choose Install from a package manager or build from source.

And you need to select which servers you want to add to the HAProxy configuration and some additional information like:

Role: It can be Active or Backup.

Include: Yes or No.

Connection address information.

Also, you can configure Advanced Settings like Admin User, Backend Name, Timeouts, and more.

When you finish the configuration and confirm the deployment, you can follow the progress in the Activity section on the ClusterControl UI.

And when this finishes, you can go to ClusterControl -> Nodes -> HAProxy node, and check the current status.

You can also monitor your HAProxy servers from ClusterControl checking the Dashboard section.

Conclusion

A Load Balancer can help you to handle your database traffic by balancing it between multiple servers. It is also useful to improve your high availability environment by performing failover tasks. ClusterControl can help you too with different features like auto-recovery, monitoring, deployment, and even more, and it can manage on-prem, cloud or mixed environments with different database technologies at the same time.

How Performant is Your ProxySQL Node?

$
0
0

ProxySQL has gained a lot of interest right now in the MySQL and MariaDB database world, not to mention ClickHouse which helps make the case for ProxySQL. 

It’s safe to say that ProxySQL has become the default database proxy for the MySQL family of databases (such as Percona Server, Oracle MySQL, Galera Cluster or even with MariaDB). 

ProxySQL is, in fact, an efficient problem solver with extremely rich functionalities that manage database client-server communication; acting as the middleware in a very advanced and performant approach. 

It has made possible the ability to shape the database traffic by delaying, caching, or rewriting queries on the fly. It can also be used to create an environment in which failovers will not affect applications and will be transparent to them. The ProxySQL community is very responsive and constantly builds fixes, patches, and version releases on a timely basis. 

But how performant is your ProxySQL setup, and how can you determine that your setup has been tuned correctly? This blog focuses on determining how performant your ProxySQL nodes are and how to monitor it efficiently.

Common Problems You Can Encounter With ProxySQL

ProxySQL’s default installation comes with a light-weight, simple tuning tool that is able to handle average to heavy load. Although this can depend on the type of queries sent to the middleware, it can impact and start to experience bottlenecks and latency.

Latency Issues

For example, what can lead to latency issues can be hard to determine if you lack a monitoring system. Likewise, you can manually monitor or check the stats schema just like below:

mysql> select * from stats_mysql_connection_pool\G

*************************** 1. row ***************************

        hostgroup: 20

         srv_host: 192.168.10.225

         srv_port: 3306

           status: ONLINE

         ConnUsed: 0

         ConnFree: 0

           ConnOK: 0

          ConnERR: 0

      MaxConnUsed: 0

          Queries: 0

Queries_GTID_sync: 0

  Bytes_data_sent: 0

  Bytes_data_recv: 0

       Latency_us: 1151

*************************** 2. row ***************************

        hostgroup: 20

         srv_host: 192.168.10.226

         srv_port: 3306

           status: ONLINE

         ConnUsed: 0

         ConnFree: 0

           ConnOK: 0

          ConnERR: 0

      MaxConnUsed: 0

          Queries: 0

Queries_GTID_sync: 0

  Bytes_data_sent: 0

  Bytes_data_recv: 0

       Latency_us: 470

*************************** 3. row ***************************

        hostgroup: 10

         srv_host: 192.168.10.227

         srv_port: 3306

           status: ONLINE

         ConnUsed: 0

         ConnFree: 0

           ConnOK: 0

          ConnERR: 0

      MaxConnUsed: 0

          Queries: 0

Queries_GTID_sync: 0

  Bytes_data_sent: 0

  Bytes_data_recv: 0

       Latency_us: 10855

*************************** 4. row ***************************

        hostgroup: 40

         srv_host: 192.168.10.225

         srv_port: 3306

           status: ONLINE

         ConnUsed: 0

         ConnFree: 0

           ConnOK: 0

          ConnERR: 0

      MaxConnUsed: 0

          Queries: 0

Queries_GTID_sync: 0

  Bytes_data_sent: 0

  Bytes_data_recv: 0

       Latency_us: 1151

*************************** 5. row ***************************

        hostgroup: 40

         srv_host: 192.168.10.226

         srv_port: 3306

           status: ONLINE

         ConnUsed: 0

         ConnFree: 0

           ConnOK: 0

          ConnERR: 0

      MaxConnUsed: 0

          Queries: 0

Queries_GTID_sync: 0

  Bytes_data_sent: 0

  Bytes_data_recv: 0

       Latency_us: 470

5 rows in set (0.01 sec)

This allows you to monitor latency based on the hostgroup. But it adds up the hassle unless you have to innovate and develop a script(s) that will manage to notify you.

Client Connection Errors

Maximum connection timeout due to maximum connections in the backend (database node itself) can lead you to perplexity if you are not able to determine what's the main source of the problem. You can check the stats database though to check for such aborted connections in the client or even the server and it's denied connections as follows,

mysql> select * from stats.stats_mysql_global where variable_name like '%connect%';

+-------------------------------------+----------------+

| Variable_Name                       | Variable_Value |

+-------------------------------------+----------------+

| Client_Connections_aborted          | 0 |

| Client_Connections_connected        | 205 |

| Client_Connections_created          | 10067 |

| Server_Connections_aborted          | 44 |

| Server_Connections_connected        | 30 |

| Server_Connections_created          | 14892 |

| Server_Connections_delayed          | 0 |

| Client_Connections_non_idle         | 205 |

| Access_Denied_Max_Connections       | 0 |

| Access_Denied_Max_User_Connections  | 0 |

| MySQL_Monitor_connect_check_OK      | 41350 |

| MySQL_Monitor_connect_check_ERR     | 92 |

| max_connect_timeouts                | 0 |

| Client_Connections_hostgroup_locked | 0              |

| mysql_killed_backend_connections    | 0 |

+-------------------------------------+----------------+

15 rows in set (0.01 sec)

It's also ideal if you can verify and check the backend user's max number of connections to see what are the number of connection limits it can open or use. For example, I have the following in my test,

mysql> select username, active, transaction_persistent, max_connections from mysql_users;

+---------------+--------+------------------------+-----------------+

| username      | active | transaction_persistent | max_connections |

+---------------+--------+------------------------+-----------------+

| proxydemo     | 1 | 1                   | 10000 |

| proxysql-paul | 1      | 1 | 10000           |

+---------------+--------+------------------------+-----------------+

2 rows in set (0.00 sec)

Slow Queries

Identifying the slow queries cannot be that difficult in ProxySQL, but it can be inefficient if done manually. You can check this if doing manual with the variable,

mysql> select * from stats_mysql_global where  variable_name like '%slow%';

+---------------+----------------+

| Variable_Name | Variable_Value |

+---------------+----------------+

| Slow_queries  | 2 |

+---------------+----------------+

1 row in set (0.00 sec)

While that can provide you some numbers, you might check on the table stats_mysql_query_digest under the stats schema if you want to dig deeper. For example below,

mysql> select count_star,sum_time,(sum_time/count_star)/1000 as average_time_ms,digest_text

    -> from stats_mysql_query_digest

    -> where count_star > 100 order by average_time_ms desc limit 10;

+------------+----------+-----------------+--------------------------------------+

| count_star | sum_time | average_time_ms | digest_text                          |

+------------+----------+-----------------+--------------------------------------+

| 884        | 15083961 | 17              | UPDATE sbtest1 SET k=k+? WHERE id=?  |

| 930        | 16000111 | 17              | UPDATE sbtest9 SET k=k+? WHERE id=?  |

| 914        | 15695810 | 17              | UPDATE sbtest4 SET k=k+? WHERE id=?  |

| 874        | 14467420 | 16              | UPDATE sbtest8 SET k=k+? WHERE id=?  |

| 904        | 15294520 | 16              | UPDATE sbtest3 SET k=k+? WHERE id=?  |

| 917        | 15228077 | 16              | UPDATE sbtest6 SET k=k+? WHERE id=?  |

| 907        | 14613238 | 16              | UPDATE sbtest2 SET k=k+? WHERE id=?  |

| 900        | 15113004 | 16              | UPDATE sbtest5 SET k=k+? WHERE id=?  |

| 917        | 15299381 | 16              | UPDATE sbtest7 SET k=k+? WHERE id=?  |

| 883        | 15010119 | 16              | UPDATE sbtest10 SET k=k+? WHERE id=? |

+------------+----------+-----------------+--------------------------------------+

10 rows in set (0.01 sec)

which catches top 10 slow queries based on a sampling by 100. 

Memory Utilization

Hardware items such as CPU, Disk, and Memory have to be monitored to ensure that your ProxySQL is performant. However, the most crucial thing is the memory, as ProxySQL will utilize heavily in the memory due to the query cache mechanism. By default, the query cache, which is dependent on the variable mysql-query_cache_size_MB defaults to 256 Mib. With that regard, it can come to a situation where it uses memory and you need to determine and diagnose if you find issues within your ProxySQL node or even being noticed within the application layer.

When identifying this, you might end up checking the tables in the stats_history and stats schemas. You can see the list of tables which can help you during diagnosis,

mysql> show tables from stats;

| stats_memory_metrics                 |

19 rows in set (0.00 sec)

or,

mysql> show tables from stats_history;

+------------------------+

| tables                 |

+------------------------+

| mysql_connections      |

| mysql_connections_day  |

| mysql_connections_hour |

| mysql_query_cache      |

| mysql_query_cache_day  |

| mysql_query_cache_hour |

| system_cpu             |

| system_cpu_day         |

| system_cpu_hour        |

| system_memory          |

| system_memory_day      |

| system_memory_hour     |

+------------------------+

15 rows in set (0.00 sec)

Efficiently Determining The Performance of your ProxySQL

There are multiple ways to determine the performance of your ProxySQL node. Using ClusterControl offers you the ability to determine this with simple yet straightforward graphs. For example, when ProxySQL is integrated into your cluster, you'll be able to set your query rules, change user's max_connections, determine the top queries, change a user host group, and provide you the performance of your ProxySQL node. See the screenshots below...

All you see is the proof of how proficiently ClusterControl can give you insights of the performance of your ProxySQL node. But this does not limit you to that. ClusterControl also has rich and powerful dashboards we call SCUMM, which includes ProxySQL Overview dashboard. 

If you intend to determine slow queries, you can simply take a glance to the dashboard. Checking your latency distribution over the different hostgroups where your backend nodes are assigned helps you to have a quick insight of the performance based on distribution. You can monitor the client and server connections, providing you query cache insights. Most importantly and not the least, it gives you the memory utilization that ProxySQL node is using. See the graphs below...

These graphs are part of the dashboard which simply helps you to easily determine the performance of your ProxySQL node.

ClusterControl doesn't limit you when dealing with ProxySQL. Also, there's a rich feature here where you can also take a backup or import the configuration which is very important when you are dealing with high-availability for your ProxySQL nodes.

Conclusion

It's never been easier to monitor and determine if you have any issues with your ProxySQL. Like in the example of this blog, we're showcasing ClusterControl as a tool that can provide you efficiency and give you insights to determine the outstanding issues that you are dealing with your performance related problems.

A Guide to Configuring a Load Balancer in a MongoDB Sharded Cluster

$
0
0

For any database, the load balancing of all the requests coming from clients is an important and fundamental mechanism to ensure scalability. A proper load balancing solution spreads all the client requests evenly across all of the database resources. If the database cluster is not guarded with a proper load balancing solution, your database won’t be able to handle increased traffic load on it.

Fortunately, MongoDB provides in-built support for load balancing the high traffic by supporting horizontal scaling through sharding. You can distribute the data of your collections across multiple servers using sharding. You can also add new servers/machines to your cluster to handle the increased traffic on the database. You can follow this guide to convert your MongoDB replica cluster into a sharding cluster.

In this article, we will learn about the behavior of the balancer process which runs in the MongoDB sharded clusters and how to modify its behavior. The MongoDB balancer process takes care of distributing your collections evenly across the shards. For example, if one shard of your cluster contains too many chunks of your sharded collection, that particular shard can receive more traffic in comparison to other shards. Therefore, the balancer process balances the chunks of collections properly across the shards. In most of the MongoDB deployments, the default configurations of the balancer process are sufficient enough for normal operations. But, in some situations, database administrators might want to alter the default behavior of this process. If you want to modify the default behavior of the balancer process for any application-level needs or operational requirements then you can follow this guide.

Let’s start with some basic commands to get some information about the balancer process state and status.

Balancer State Status

This command checks whether the balancer is enabled or permitted to run or not. If the balancer process is not running then this command will return false. This will not check whether the balancer process is running or not.

sh.getBalancerState()

Enable the Balancer Process

If the balancer is not enabled by default then you can enable it by running the following command. This command will not start the balancer process but it will enable the process and ensures that chunk balancing won’t be blocked when the balancer process runs the next time.

sh.enableBalancing(<collection_name/namespace>)

Disable the Balancer Process

The balancer process runs at any time by default. Therefore, if you want to disable the balancer process for some specific time period then you can use the following command. One ideal scenario to use this command is when you are taking a backup of your database. 

sh.stopBalancer()

Make sure that the balancer process is stopped before taking the backup. If the process is enabled while taking the database backup, you may end up with some inconsistent replica of your database. This can happen when the balancer process moves some chunks across the shards for load balancing during the backup process.

You can also disable the balancing on some specific collections by providing the full namespace of a collection as a parameter using the following command.

sh.disableBalancing("<db_name>.<collection_name>")

Balancer Running Status

This command checks whether the balancer process is running or not. It also checks whether it is actively managing the sharding chunks or not. Returns true if the process is running otherwise returns false.

sh.isBalancerRunning()

Default Chunk Size Configurations

By default, the chunk size in any MongoDB sharded cluster is 64MB. For most of the scenarios, this is good enough for migrating or splitting the sharded chunks. However, sometimes the normal migration process involves more no of I/O operations than your hardware can process. In these types of situations, you may want to reduce the size of chunks. You can do so by running the following set of commands. 

use config

db.settings.save( { _id:"chunksize", value: <sizeInMB> } )

If you change the default the chunk size in the sharded cluster, keep the following things in mind

  • You can specify the chunk size only between 1 to 1024 MB
  • Automatic splitting will only happen on insert or update
  • Lower chunk sizes will lead to more time during the splitting process.

Schedule Balancing for a Specific Time

When your database size is huge, balancing or migration processes can impact the overall performance of your database. Therefore, it is wise to schedule the balancing process during a specific time window when the load on the database is very less. You can use the following commands to set the time window for the balancer process to run.

use config

db.settings.update({ _id : "balancer" }, { $set : { activeWindow : { start : "<start-time>", stop : "<stop-time>" } } }, true )

Example

Following command will set the time window from 1: 00 AM to 5: 00 AM for the balancing process to run. 

db.settings.update({ _id : "balancer" }, { $set : { activeWindow : { start : "01:00", stop : "05:00" } } }, true )

Make sure that the given timeframe is sufficient enough for a complete balancing process.

You can also remove any existing balancing process time window by running the following command.

db.settings.update({ _id : "balancer" }, { $unset : { activeWindow : true } })

Apart from the above commands, you can also change the replication behavior while doing the chunk migration process by using the _secondaryThrottle parameter. Also, you can use the _waitForDelete property with moveChunk command to tell the balancing process to wait for the current migration’s delete phase before starting with the new chunk migration phase.

Conclusion

Hopefully, this will be all you need while changing the default behavior of the MongoDB balancer process. Balancing is a very important aspect of any MongoDB sharded cluster. So, if you know about the balancing process in detail, it becomes very easy to modify the default behavior of the balancer process according to your needs and use cases.

Announcing ClusterControl 1.7.6: HA Stack Deployments in the Cloud with HAProxy

$
0
0

We’re excited to announce the 1.7.6 release of ClusterControl - the only database management system you’ll ever need to take control of your open source database infrastructure. 

This new edition expands our commitment to cloud integration by allowing a user to deploy a SQL database stack to the cloud provider of your choice with the HAProxy load balancer pre-configured. This makes it even simpler and faster to get a highly available deployment of the most popular open source databases into the cloud with just a couple of clicks.

In addition to this new function we also have improved our new MySQL Freeze Frame system by adding the ability to snapshot the process list before a cluster failure.

Release Highlights

Simple Cloud Deployment of HA Database Stack with Integrated HAProxy

  • Improvements to the cloud deployment GUI to allow deployment and configuration of HAProxy along with the database stack to the cloud provider of your choosing. 

MySQL Freeze Frame (BETA)

  • Now snapshots the MySQL process list before a cluster failure.

Additional Misc Improvements

  • CMON Upgrade operations are logged in a log file.
  • Many improvements and fixes to PostgreSQL Backup, Restore, and Verify Backup. 
  • A number of legacy ExtJS pages have been migrated to AngularJS.

View Release Details and Resources

Release Details

Cloud Deployment of HA Database Stack with Integrated HAProxy 

In ClusterControl 1.6 we introduced the ability to directly deploy a database cluster to the cloud provider of your choosing. This made the deployment of highly available database stacks simpler than it had ever been before. Now with the new release we are adding the ability to deploy an HAProxy Load Balancer right alongside the database in a complete, pre-configured full stack.

Load balancers are an essential part of traffic management and performance, and you can now deploy a pre-integrated database/load balancer stack using our easy-to-use wizard.

PostgreSQL Improvements

Over the course of the last few months, we have been releasing several patches which culminated in the release of ClusterControl 1.7.6. You can review the changelog to see all of them. Here are some of the highlights...

  • Addition of Read/Write Splitting for HAProxy for PostgreSQL
  • Improvements to the Backup Verification process
  • Improvements to the Restore & Recovery functions
  • Several fixes and improvements regarding Point-in-Time Recovery
  • Bug fixes regarding the Log & Configuration files
  • Bug fixes regarding process monitoring & dashboards

PostgreSQL Load Balancing in the Cloud Made Easy

$
0
0

We’d mentioned many times the advantages of using a Load Balancer in your database topology. It could be for redirecting traffic to healthy database nodes, distribute the traffic across multiple servers to improve performance, or just to have a single endpoint configured in your application for an easier configuration and failover process.

Now with the new ClusterControl 1.7.6 version, you can not only deploy your PostgreSQL cluster directly in the cloud, but also you can deploy Load Balancers in the same job. For this, ClusterControl supports AWS, Google Cloud, and Azure as cloud providers. Let’s take a look at this new feature.

Creating a New Database Cluster

For this example, we’ll assume that you have an account with one of the supported cloud providers mentioned, and configured your credentials in a ClusterControl 1.7.6 installation.

If you don’t have it configured, you must go to ClusterControl -> Integrations -> Cloud Providers -> Add Cloud Credentials.

Here, you must choose the cloud provider and add the corresponding information.

This information depends on the cloud provider itself. For more information, you can check our official documentation.

You don’t need to access your cloud provider management console to create anything, you can deploy your Virtual Machines, Databases, and Load Balancers directly from ClusterControl. Go to the deploy section and select “Deploy in the Cloud”.

Specify vendor and version for your new database cluster. In this case, we’ll use PostgreSQL 12.

Add the number of nodes, cluster name, and database information like credentials and server port.

Choose the cloud credentials, in this case, we’ll use an AWS account. If you don’t have your account added into ClusterControl yet, you can follow our documentation for this task.

Now you must specify the virtual machine configuration, like operating system, size, and region.

In the next step, you can add Load Balancers to your Database Cluster. For PostgreSQL, ClusterControl supports HAProxy as Load Balancer. You need to select the number of Load Balancer nodes, instance size, and the Load Balancer information. 

This Load Balancer information is:

  • Listen Port (Read/Write): Port for read/write traffic.
  • Listen Port (Read-Only): Port for read-only traffic.
  • Policy: It can be:
    • leastconn: The server with the lowest number of connections receives the connection
    • roundrobin: Each server is used in turns, according to their weights
    • source: The source IP address is hashed and divided by the total weight of the running servers to designate which server will receive the request

Now you can review the summary and deploy it.

ClusterControl will create the virtual machines, install the software, and configure it, all in the same job and in an unattended way.

You can monitor the creation process in the ClusterControl activity section. When it finishes, you will see your new cluster in the ClusterControl main screen.

If you want to check the Load Balancers nodes, you can go to ClusterControl -> Nodes -> HAProxy node, and check the current status.

You can also monitor your HAProxy servers from ClusterControl by checking the Dashboard section.

Now you are done, you can check your cloud provider management console, where you will find the Virtual Machines created according to your selected ClusterControl job options.

Conclusion

As you could see, having a Load Balancer in front of your PostgreSQL cluster in the cloud is really easy using the new ClusterControl“Deploy in the Cloud” feature, where you can deploy your Databases and Load Balancer nodes in the same job.

Manage Engine HAProxy Monitoring Alternatives - ClusterControl HAProxy Monitoring

$
0
0

In a previous blog, we looked at the differences between ManageEngine Applications Manager and ClusterControl, examining the main features of each and comparing them. In this blog we will focus on the monitoring of HAProxy, how to monitor an HAProxynode and compare the specific monitoring features of these two tools.

For this blog, we’ll assume you already have Applications Manager or ClusterControl installed.

HAProxy Monitoring Usage Comparison

Manage Engine Applications Manager

To start monitoring your HAProxy node, it must be installed previously, as you only can import it here. In your Applications Manager server, go to New Monitor -> Add New Monitor. You’ll see all the available options to monitor, so you need to choose the HAProxy option under the Web Server/Services section.

Now you must specify the following information of your HAProxy node: 

  • Display Name: It’ll be used to identify the node.
  • Hostname/IP Address: Of the existing HAProxy node.
  • Admin Port: It’s specified in the HAProxy configuration file.
  • Credentials: Admin credentials if needed.
  • Stats URL: URL to access the HAProxy stats.

Before pressing “Add Monitor”, you can test the credentials to confirm that it’s working correctly.

After you have your HAProxy monitored by Application Manager, you can access it from the Home section.

ClusterControl

In this case, it’s not necessary to have the HAProxy node installed, as you can deploy it using ClusterControl. We’ll assume you have a Database Cluster added into ClusterControl, so if you go to the cluster actions, you’ll see the Add Load Balancer option.

In this step, you can choose if you want to Deploy or Import it.

For the deployment, you must specify the following information:

  • Server Address: IP Address for your HAProxy server.
  • Listen Port (Read/Write): Port for read/write traffic.
  • Listen Port (Read-Only): Port for read-only traffic.
  • Policy: It can be:
    • leastconn: The server with the lowest number of connections receives the connection
    • roundrobin: Each server is used in turns, according to their weights
    • source: The source IP address is hashed and divided by the total weight of the running servers to designate which server will receive the request
  • Build from Source: You can choose Install from a package manager or build from source.
  • And you need to select which servers you want to add to the HAProxy configuration and some additional information like:
  • Role: It can be Active or Backup.
  • Include: Yes or No.
  • Connection address information.

Also, you can configure Advanced Settings like Admin User, Backend Name, Timeouts, and more.

For the import action, you must specify the current HAProxy information, like:

  • Server Address: IP Address for your HAProxy server.
  • Port: HAProxy admin port.
  • Admin User/Admin Password: HAProxy admin credentials.
  • HAProxy Config: HAProxy configuration file location.
  • Stats Socket: HAProxy stats socket.

Most of these values are auto-filled with the default values, so if you’re using a default HAProxy configuration, you shouldn’t change anything.

When you finish the configuration and confirm the deploy or import process, you can follow the progress in the Activity section on the ClusterControl UI.

Monitoring Your HAProxy Node

HAProxy Monitoring with Manage Engine Applications Manager

If you go into the HAProxy node, you’ll see an Availability History section.

In the Performance tab, you’ll have useful information about the HAProxy performance per hour plus a graph showing the Response Time.

If you press on the HAProxy link under the Healthy History section, you’ll access more detailed information about it, with different metrics and graphs.

In the Monitor Information tab, you’ll see the data added during the import process.

Then, you have the Listener, Frontend, Backend, and Server tabs, where you have metrics about each section, like Session Utilization, Transaction Details, Response Times, and even more.

Finally, in the Configuration tab, you’ll see some HAProxy configuration values like max connections and version.

HAProxy Monitoring with ClusterControl

When you have your HAProxy node added into ClusterControl, you can go to ClusterControl -> Select Cluster -> Nodes -> HAProxy node, and check the current status.

You can also check the Topology section, to have a complete overview of the environment.

But if you want to see more detailed information about your HAProxy node, you have the Dashboards section.

Here, you can’t only see all the necessary metrics to monitor the HAProxy node, but also to monitor all the environment using the different Dashboards.

Alarms & Notifications

Manage Engine Applications Manager Notifications

As we mentioned in the previous related blog, this system has its own alarm system where you must configure actions to be run when the alarm is generated.

You can configure alarms and actions, and you can also integrate it with their own Alarm System called AlarmsOne (a different product).

ClusterControl Notifications

It also has an alarm system using advisors. ClusterControl comes with some predefined advisors, but you can modify it or even create a new one using the Developer Studio integrated tool.

It has integration with 3rd party tools like Slack or PagerDuty, so you can receive notifications there too.

Command Line Monitoring

Applications Manager CLI

Unfortunately, this system doesn’t have a command-line tool that allows you to monitor applications or databases from the command line.

ClusterControl CLI (s9s)

For scripting and automating tasks, or even if you just prefer the command line, ClusterControl has the s9s tool. It's a command-line tool for managing your database cluster.

$ s9s node --cluster-id=8 --list --long

STAT VERSION    CID CLUSTER HOST            PORT COMMENT

coC- 1.7.6.3910   8 My1     192.168.100.131 9500 Up and running.

?o-- 2.12.0       8 My1     192.168.100.131 9090 Process 'prometheus' is running.

soM- 8.0.19       8 My1     192.168.100.132 3306 Up and running.

soS- 8.0.19       8 My1     192.168.100.133 3306 Up and running.

ho-- 1.8.15       8 My1     192.168.100.134 9600 Process 'haproxy' is running.

Total: 5

With this tool, you can perform all the tasks that you have in the ClusterControl UI, and even more. You can check the documentation to have more examples and information about the usage of this powerful tool.

Conclusion

As you could see, both systems are useful to monitor an HAProxy node. They have graphs, metrics, and alarms to help you to know the current status of your HAProxy node. The main differences between them are the possibility of ClusterControl to deploy the HAProxy node itself, avoiding manual tasks, and also the ClusterControl CLI feature, that allows you to import/deploy, manage, or monitor everything from the command line.

Apart from that, both solutions are a good way to keep your systems monitored all the time

proxysql-admin Alternatives - ClusterControl ProxySQL GUI

$
0
0

ProxySQL is a very popular proxy in MySQL environments. It comes with a nice set of features including read/write splitting, query caching and query rewriting. ProxySQL stores its configuration in SQLite database, configuration changes can be applied on runtime and are performed through SQL commands. This increases the learning curve and could be a blocker for some people that would like to just install it and get it running. 

This is a reason why a couple of tools exist that can help you to manage ProxySQL. Let’s take a look at one of them, proxysql-admin, and compare it with features available for ProxySQL in ClusterControl.

proxysql-admin

Proxysql-admin is a tool that comes included in the ProxySQL when installed from Percona repositories. It is dedicated to making the setup of Percona XtraDB Cluster in ProxySQL easier. You can define the setup in the configuration file (/etc/proxysql-admin.cnf) or through arguments to the proxysql-admin command. It is possible to:

  1. Configure hostgroups (reader, writer, backup writer, offline) for PXC
  2. Create monitoring user in ProxySQL and PXC
  3. Create application user in ProxySQL and PXC
  4. Configure ProxySQL (maximum running connections, maximum transactions behind)
  5. Synchronize users between PXC and ProxySQL
  6. Synchronize nodes between PXC and ProxySQL
  7. Create predefined (R/W split) query rules for users imported from PXC
  8. Configure SSL for connections from ProxySQL to the backend databases
  9. Define a single writer or round robin access to the PXC

As you can see, this is by no means a complex tool, it focuses on the initial setup. Let’s take a look at couple examples.

root@vagrant:~# proxysql-admin --enable


This script will assist with configuring ProxySQL for use with

Percona XtraDB Cluster (currently only PXC in combination

with ProxySQL is supported)


ProxySQL read/write configuration mode is singlewrite


Configuring the ProxySQL monitoring user.

ProxySQL monitor user name as per command line/config-file is proxysql-monitor


The monitoring user is already present in Percona XtraDB Cluster.


Would you like to enter a new password [y/n] ? n


Monitoring user 'proxysql-monitor'@'10.%' has been setup in the ProxySQL database.


Configuring the Percona XtraDB Cluster application user to connect through ProxySQL

Percona XtraDB Cluster application user name as per command line/config-file is proxysql_user


Application user 'proxysql_user'@'10.%' already present in PXC.


Adding the Percona XtraDB Cluster server nodes to ProxySQL


Write node info

+------------+--------------+------+--------+

| hostname   | hostgroup_id | port | weight |

+------------+--------------+------+--------+

| 10.0.0.152 | 10           | 3306 | 1000   |

+------------+--------------+------+--------+


ProxySQL configuration completed!


ProxySQL has been successfully configured to use with Percona XtraDB Cluster


You can use the following login credentials to connect your application through ProxySQL


mysql --user=proxysql_user -p --host=localhost --port=6033 --protocol=tcp

Above shows the initial setup. As you can see, a singlewriter (default) mode was used, monitoring and application users have been configured and the whole server configuration was prepared.

root@vagrant:~# proxysql-admin --status


mysql_galera_hostgroups row for writer-hostgroup: 10

+--------+--------+---------------+---------+--------+-------------+-----------------------+------------------+

| writer | reader | backup-writer | offline | active | max_writers | writer_is_also_reader | max_trans_behind |

+--------+--------+---------------+---------+--------+-------------+-----------------------+------------------+

| 10     | 11     | 12            | 13      | 1      | 1           | 2                     | 100              |

+--------+--------+---------------+---------+--------+-------------+-----------------------+------------------+


mysql_servers rows for this configuration

+---------------+-------+------------+------+--------+--------+----------+---------+-----------+

| hostgroup     | hg_id | hostname   | port | status | weight | max_conn | use_ssl | gtid_port |

+---------------+-------+------------+------+--------+--------+----------+---------+-----------+

| writer        | 10    | 10.0.0.153 | 3306 | ONLINE | 1000   | 1000     | 0       | 0         |

| reader        | 11    | 10.0.0.151 | 3306 | ONLINE | 1000   | 1000     | 0       | 0         |

| reader        | 11    | 10.0.0.152 | 3306 | ONLINE | 1000   | 1000     | 0       | 0         |

| backup-writer | 12    | 10.0.0.151 | 3306 | ONLINE | 1000   | 1000     | 0       | 0         |

| backup-writer | 12    | 10.0.0.152 | 3306 | ONLINE | 1000   | 1000     | 0       | 0         |

+---------------+-------+------------+------+--------+--------+----------+---------+-----------+

Here is the output of the default configuration of the PXC nodes in ProxySQL.

ClusterControl

ClusterControl is, in comparison to the proxysql-admin, a way more complex solution. It can deploy a ProxySQL load balancer and preconfigure it according to the user requirements.

When deploying you can define administrator user and password, monitoring user and you can as well import one of the existing MySQL users (or create a new one if this is what you need) for the application to use. It is also possible to import ProxySQL configuration from other ProxySQL that you already have in the cluster. It makes the deployment faster and more efficient.

What is also important to mention is that ClusterControl can deploy ProxySQL in both MySQL and Galera Clusters. It can be used with MySQL, Percona and MariaDB flavours of MySQL.

Once deployed, ClusterControl gives you options to fully manage ProxySQL via an easy to use GUI.

You can monitor your ProxySQL instance.

You can check the heavier queries executed through ProxySQL. It is also possible to create a query rule based on the exact query.

ClusterControl configures ProxySQL for a read/write split. It is also possible to add custom query rules based on your requirements and application configuration. 

Compared to proxysql-admin, ClusterControl gives you full control over the server configuration. You can add new servers, you can move them around host groups as you want. You can create new hostgroups (and then, for example, create new query rules for them).

It is also possible to manage users in ProxySQL. You can edit existing users, import new users that exist in the backend database.

Bulk import is also possible to accomplish. You can also create new users on both ProxySQL and backend databases.

ClusterControl can also be used to reconfigure ProxySQL. You can modify all of the variables through a simple UI with search option.

As you can see, ClusterControl comes with in-depth management features for ProxySQL. It allows you to deploy and manage ProxySQL instances with ease.

Database Load Balancing in a Multi-Cloud Environment

$
0
0

Multi-cloud environments are a very good solution to implement disaster recovery and very high level of high availability. They help to ensure that even a full outage of a whole region of one cloud provider will not impact your operations because you can easily switch your workload to another cloud. 

Utilizing multi-cloud setups also allows you to avoid vendor lock-in, as you are building your environment using common building blocks that can be reused in every environment (cloud or on-prem) and not something strictly tied to the particular cloud provider.

Load Balancers are one of the building blocks for any highly available environment, database clusters are no different. Designing load balancing in a multi-cloud environment might be tricky, in this blog post we will try to share some suggestions about how to do that.

Designing a Load Balancing Tier for Multi-Cloud Database Clusters

For starters, what’s important to keep in mind is that there will be differences in how you want to design your load balancer based on the type of the database cluster. We will discuss two major types: clusters with one writer and clusters with multiple writers. 

Clusters with one writer are, typically, replication clusters where, by design, you have only one writable node, the master. We can also put here multi-writer clusters when we want to use just one writer at the same time. Clusters with multiple writers are multi-master setups like Galera Cluster for MySQL, MySQL Group Replication or Postgres-BDR. The database type may make some small differences but they are not as significant as the type of the cluster, thus we’ll stick to the more generic approach and try to keep the broader picture.

The most important thing we have to keep in mind while designing the load balancing tier is its high availability. This may be especially tricky for the multi-cloud clusters. We should ensure that the loss of the connectivity between the cloud providers will be handled properly.

Multi-Cloud Load Balancing - Multi-Writer Clusters

Let’s start with multi-writer clusters. The fact that we have multiple writers makes it easier for us to design load balancers. Write conflicts are typically handled by the database itself therefore, from the load balancing standpoint, all we need to do is fire and forget - send the traffic to one of the available nodes and that’s pretty much it. What’s also great about multi-writer clusters is that they, typically, are quorum-based and any kind of a network partitioning should be handled pretty much automatically. Thanks to that we don’t have to be worried about split brain scenarios - that makes our lives really easy.

What we have to focus on is the high availability of the load balancers. We can achieve that by leveraging highly available load balancing options. Again, we’ll try to keep this blog post generic but we are talking here about tools like Elastic Load Balancing in AWS or Cloud Load Balancing in GCP. Those products are designed to be highly available and scalable and while they are not designed to work with databases, we can quite easily use them to provide load balancing in front of our loadbalancer tier. What’s needed is a couple of scripts to ensure that cloud load balancers will be able to run health checks against database load balancers of our choosing. An example setup may look like this:

Multi-Cloud Database Load Balancing - Multi-Writer Clusters

What we see here is an environment that consists of three clouds (it can be multiple regions from the same cloud provider, multiple cloud providers for multi-cloud environment or even hybrid cloud that connects multiple cloud providers and on-prem data centers. Each environment is built in a similar way. There are application hosts that connect to the first layer of the load balancers. As we mentioned earlier, those have to be highly available load balancers like those provided by GCP or AWS. For on-prem this can be delivered by one of Virtual IP-based solutions like Keepalived. Traffic then is sent to the dedicated database load balancing tier - ProxySQL, MySQL Router, MaxScale, pgbouncer, HAProxy or similar. That tier is tracking the state of the databases colocated in the same segment and sends the traffic towards them.

Multi-Cloud Load Balancing - Single Writer Setups

This kind of setup is definitely more complex to design given that we have to keep in mind that we can have only one writer in the mix. Main challenge would be to be able to consistently keep track of the writer, ensuring that all of the load balancers will send the writes to the correct destination. There are several ways of doing this and we’ll give you some examples. For starters good old DNS. DNS can be used to store the hostname that is pointing to the writer. Load Balancers then can be configured to send their writes to, for example, writer.databases.mywebsite.com. Then it will be up to the failover automation to ensure that the ‘writer.databases.mywebsite.com’ will be updated after the failover and that it points towards the correct database node. This has pros and cons, as you may expect. DNS is not really designed with low latency in mind therefore changing the records comes with a delay. TTL can be reduced, sure, but will never be real-time.

Another option is to use service discovery tools. Solutions like etc.d or Consul can be used to store information about the infrastructure and, among others, information which node performs the role of the writer. This information can be utilized by load balancers, helping them to point write traffic to the correct destination. Some of the service discovery tools can expose infrastructure information as DNS records, which allows you to combine both solutions if you feel that’s needed.

Let’s take a look at an example of an environment where we have a single writer in one of the cloud providers.

Multi-Cloud Database Load Balancing - Single Writer Setups

What we have here are three data centers, cloud providers or regions. In one of them we have a writer and all of the writes coming from all load balancers in all cloud providers will be directed to that writer node. Reads are being distributed across other database nodes in the same location. The Consul cluster has been deployed across the whole infrastructure, storing the information about the writer node. Consul cluster can, eventually, be also used to reduce the risk that comes with a split-brain. Scripts can be prepared to track the state of Consul nodes and, should the node lost connectivity with the rest of the Consul cluster, it may assume that the network partitioning has happened and take some actions as needed (or, even more importantly, do not take some actions like promoting new writer). Should the writer fail, an automated failover solution should check the state of the Consul node to make sure that network is working properly. If yes, a new writer should be promoted among all the nodes. Up to you is to decide if it is feasible to failover to nodes from multiple clouds or would you prefer to promote one of the nodes colocated with the failed writer. Once failover is completed, the Consul should be updated with information about the new location to send writes to. Load Balancers will pick it up and the regular flow of traffic will be restored.

Conclusion

As you can see, designing a proper load balancing solution for databases in a multi-cloud environment, even if not trivial, it is definitely possible. This blog post should give you an overview of the challenges you will face and solutions to them. We hope it will make your job in implementing such a setup way easier.


What's New in MariaDB MaxScale 2.4

$
0
0

MaxScale 2.4 was released on December 21st, 2019, and ClusterControl 1.7.6 supports the monitoring and managing up to this version. However, for deployment, ClusterControl only supports up to version 2.3. One has to manually upgrade the instance manually, and fortunately, the upgrade steps are very straightforward. Just download the latest version from MariaDB MaxScale download page and perform the package installation command. 

The following commands show how to upgrade from an existing MaxScale 2.3 to MaxScale 2.4 on a CentOS 7 box:

$ wget https://dlm.mariadb.com/1067184/MaxScale/2.4.10/centos/7/x86_64/maxscale-2.4.10-1.centos.7.x86_64.rpm
$ systemctl stop maxscale
$ yum localinstall -y maxscale-2.4.10-1.centos.7.x86_64.rpm
$ systemctl start maxscale
$ maxscale --version
MaxScale 2.4.10

In this blog post, we are going to highlight some of the notable improvements and new features of this version and how it looks like in action. For a full list of changes in MariaDB MaxScale 2.4, check out its changelog.

Interactive Mode Command History

This is basically a small improvement with a major impact on MaxScale administration and monitoring task efficiency. The interactive mode for MaxCtrl now has its command history. Command history easily allows you to repeat the executed command by pressing the up or down arrow key. However, Ctrl+R functionality (recall the last command matching the characters you provide) is still not there.

In the previous versions, one has to use the standard shell mode to make sure the commands are captured by .bash_history file.

GTID Monitoring for galeramon

This is a good enhancement for those who are running on Galera Cluster with geographical redundancy via asynchronous replication, also known as cluster-to-cluster replication, or MariaDB Galera Cluster replication over MariaDB Replication.

In MaxScale 2.3 and older, this is what it looks like if you have enabled master-slave replication between MariaDB Clusters:

Maxscale 2.4

For MaxScale 2.4, it is now looking like this (pay attention to Galera1's row):

Maxscale 2.4

It's now easier to see the replication state for all nodes from MaxScale, without the need to check on individual nodes repeatedly.

SmartRouter

This is one of the new major features in MaxScale 2.4, where MaxScale is now smart enough to learn which backend MariaDB backend server is the best to process the query. SmartRouter keeps track of the performance, or the execution time, of queries to the clusters. Measurements are stored with the canonical of a query as the key. The canonical of a query is the SQL with all user-defined constants replaced with question marks, for example:

UPDATE `money_in` SET `accountholdername` = ? , `modifiedon` = ? , `status` = ? , `modifiedby` = ? WHERE `id` = ? 

This is a very useful feature if you are running MariaDB on a multi-site geographical replication or a mix of MariaDB storage engines in one replication chain, for example, a dedicated slave to handle transaction workloads (OLTP) with InnoDB storage engine and another dedicated slave to handle analytics workloads (OLAP) with Columnstore storage engine.

Supposed we are having two sites - Sydney and Singapore as illustrated in the following diagram:

Maxscale 2.4

The primary site is located in Singapore and has a MariaDB master and a slave, while another read-only slave is located in Sydney. The application connects to the MaxScale instance located in its respective country with the following port settings:

  • Read-write split: 3306
  • Round robin: 3307
  • Smart router: 3308

Our SmarRouter service and listener definitions are:

[SmartQuery]
type=service
router=smartrouter
servers=DB_1,DB_2,DB_5
master=DB_1
user=maxscale
password=******
[SmartQuery-Listener]
type = listener
service = SmartQuery
protocol = mariadbclient
port = 3308

Restart MaxScale and start sending a read-only query to both MaxScale nodes located in Singapore and Sydney. If the query is processed by the round-robin router (port 3307), we would see the query is being routed based on the round-robin algorithm:

(app)$ mysql -usbtest -p -h maxscale_sydney -P3307 -e 'SELECT COUNT(id),@@hostname FROM sbtest.sbtest1'
+-----------+--------------------+
| count(id) | @@hostname         |
+-----------+--------------------+
|   1000000 | mariadb_singapore2 |
+-----------+--------------------+

From the above, we can tell that Sydney's MaxScale forwarded the above query to our Singapore's slave, which is not the best routing option per se.

With SmartRouter listening on port 3308, we would see the query is being routed to the nearest slave in Sydney:

(app)$ mysql -usbtest -p -h maxscale_sydney -P3308 -e 'SELECT COUNT(id),@@hostname FROM sbtest.sbtest1'
+-----------+-----------------+
| count(id) | @@hostname      |
+-----------+-----------------+
|   1000000 | mariadb_sydney1 |
+-----------+-----------------+

And if the same query is executed in our Singapore site, it will be routed to the MariaDB slave located in Singapore:

(app)$ mysql -usbtest -p -h maxscale_singapore -P3308 -e 'SELECT COUNT(id),@@hostname FROM sbtest.sbtest1'
+-----------+--------------------+
| count(id) | @@hostname         |
+-----------+--------------------+
|   1000000 | mariadb_singapore2 |
+-----------+--------------------+

There is a catch though. When SmartRouter sees a read-query whose canonical has not been seen before, it will send the query to all clusters. The first response from a cluster will designate that cluster as the best one for that canonical. Also, when the first response is received, the other queries are canceled. The response is sent to the client once all clusters have responded to the query or the cancel.

This means, to keep track of the canonical query (normalized query) and measure its performance, you probably will see the very first query fails in its first execution, for example:

(app)$ mysql -usbtest -p -h maxscale_sydney -P3308 -e 'SELECT COUNT(id),@@hostname FROM sbtest.sbtest1'
ERROR 2013 (HY000) at line 1: Lost connection to MySQL server during query

From the general log in MariaDB Sydney, we can tell that the first query (ID 74) was executed successfully (connect, query and quit), despite the "Lost connection" error from MaxScale:

  74 Connect  sbtest@3.25.143.151 as anonymous on 
  74 Query    SELECT COUNT(id),@@hostname FROM sbtest.sbtest1
  74 Quit

While the identical subsequent query was correctly processed and returned with the correct response:

(app)$ mysql -usbtest -p -h maxscale_sydney -P3308 -e 'SELECT COUNT(id),@@hostname FROM sbtest.sbtest1'
+-----------+------------------------+
| count(id) | @@hostname             |
+-----------+------------------------+
|   1000000 | mariadb_sydney.cluster |
+-----------+------------------------+

Looking again at the general log in MariaDB Sydney (ID 75), the same processing events happened just like the first query:

  75 Connect  sbtest@3.25.143.151 as anonymous on 
  75 Query    SELECT COUNT(id),@@hostname FROM sbtest.sbtest1
  75 Quit

From this observation, we can conclude that occasionally, MaxScale has to fail the first query in order to measure performance and become smarter for the subsequent identical queries. Your application must be able to handle this "first error" properly before returning to the client or retry the transaction once more.

UNIX Socket for Server

There are multiple ways to connect to a running MySQL or MariaDB server. You could use the standard networking TCP/IP with host IP address and port (remote connection), named pipes/shared memory on Windows or Unix socket files on Unix-based systems. The UNIX socket file is a special kind of file that facilitates communications between different processes, which in this case is the MySQL client and the server. The socket file is a file-based communication, and you can't access the socket from another machine. It provides a faster connection than TCP/IP (no network overhead) and a more secure connection approach because it can be used only when connecting to a service or process on the same computer.

Supposed the MaxScale server is also installed on the MariaDB Server itself, we can use the socket UNIX socket file instead. Under the Server section, remove or comment the "address" line and add the socket parameter with the location of the socket file:

[DB_2]
type=server
protocol=mariadbbackend
#address=54.255.133.39
socket=/var/lib/mysql/mysql.sock

Before applying the above changes, we have to create a MaxScale axscale user from localhost. On the master server:

MariaDB> CREATE USER 'maxscale'@'localhost' IDENTIFIED BY 'maxscalep4ss';
MariaDB> GRANT SELECT ON mysql.user TO 'maxscale'@'localhost';
MariaDB> GRANT SELECT ON mysql.db TO 'maxscale'@'localhost';
MariaDB> GRANT SELECT ON mysql.tables_priv TO 'maxscale'@'localhost';
MariaDB> GRANT SHOW DATABASES ON *.* TO 'maxscale'@'localhost';

After a restart, MaxScale will show the UNIX socket path instead of the actual address, and the server listing will be shown like this:

Maxscale 2.4

As you can see, the state and GTID information are retrieved correctly through a socket connection. Note that this DB_2 is still listening to port 3306 for the remote connections. It just shows that MaxScale uses a socket to connect to this server for monitoring.

Using socket is always better due to the fact that it only allows local connections and it is more secure. You could also close down your MariaDB server from the network (e.g, --skip-networking) and let MaxScale handle the "external" connections and forward them to the MariaDB server via UNIX socket file.

Server Draining

In MaxScale 2.4, the backend servers can be drained, which means existing connections can continue to be used, but no new connections will be created to the server. With the drain feature, we can perform a graceful maintenance activity without affecting the user experience from the application side. Note that draining a server can take a longer time, depending on the running queries that need to be gracefully closed.

To drain a server, use the following command:

Maxscale 2.4

The after-effect could be one of the following states:

  • Draining - The server is being drained.
  • Drained - The server has been drained. The server was being drained and now the number of connections to the server has dropped to 0.
  • Maintenance - The server is under maintenance.

After a server has been drained, the state of the MariaDB server from MaxScale point of view is "Maintenance":

Maxscale 2.4

When a server is in maintenance mode, no connections will be created to it and existing connections will be closed.

Conclusion

MaxScale 2.4 brings a lot of improvements and changes over the previous version and it's the best database proxy to handle MariaDB servers and all of its components.

Viewing all 98 articles
Browse latest View live


Latest Images